Unlock a world of possibilities! Login now and discover the exclusive benefits awaiting you.
- Qlik Community
- :
- All Forums
- :
- QlikView App Dev
- :
- Re: Some of my values arent displaying within bar ...
- Subscribe to RSS Feed
- Mark Topic as New
- Mark Topic as Read
- Float this Topic for Current User
- Bookmark
- Subscribe
- Mute
- Printer Friendly Page
- Mark as New
- Bookmark
- Subscribe
- Mute
- Subscribe to RSS Feed
- Permalink
- Report Inappropriate Content
Some of my values arent displaying within bar chart
Hey all,
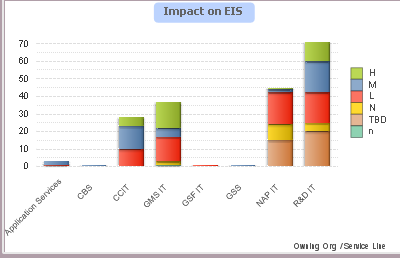
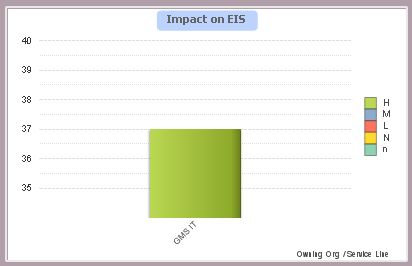
I have a bar chart within QlikView that displays the number of projects within certain teams and they are broken down by their impacts (H,M,L,N,TBD). On the highest level of the bar chart, everything seems to work fine. However, when I click on one of the teams, it only shows one of the impact levels (usually H) rather than just enlarging the previous charts results. I have a table made that lists all the projects as well, and the table still shows all the projects from all the different impacts. They are simply not being displayed in the chart. Here are some pictures that will help you understand what I am talking about.
Please let me know what I can do to solve this.
Thanks,
Pete
- Mark as New
- Bookmark
- Subscribe
- Mute
- Subscribe to RSS Feed
- Permalink
- Report Inappropriate Content
Hi.
I tried it on one of my own apps and it behaves as expected. Do you have a sample? what version are you using?
- Mark as New
- Bookmark
- Subscribe
- Mute
- Subscribe to RSS Feed
- Permalink
- Report Inappropriate Content
Hard to say without knowing your data and chart properties, dimensions, expressions. Could you upload a sample file that demonstrate this issue?
I noticed that your scale on the bottom image starts on some numbers I wouldn't expect. Are you using some dynamic min / max scale ranges or something like this?
- Mark as New
- Bookmark
- Subscribe
- Mute
- Subscribe to RSS Feed
- Permalink
- Report Inappropriate Content
Can you include Current selections snapshots for the 2 charts you posted?
- Mark as New
- Bookmark
- Subscribe
- Mute
- Subscribe to RSS Feed
- Permalink
- Report Inappropriate Content
If possible sent the sample.