Unlock a world of possibilities! Login now and discover the exclusive benefits awaiting you.
- Qlik Community
- :
- All Forums
- :
- QlikView App Dev
- :
- Re: Formatting lines in line chart
- Subscribe to RSS Feed
- Mark Topic as New
- Mark Topic as Read
- Float this Topic for Current User
- Bookmark
- Subscribe
- Mute
- Printer Friendly Page
- Mark as New
- Bookmark
- Subscribe
- Mute
- Subscribe to RSS Feed
- Permalink
- Report Inappropriate Content
Formatting lines in line chart
Hi All,
How to format lines in line chart like if we want to show some dotted lines solid lines as per our requirement.
Thanks,
Accepted Solutions
- Mark as New
- Bookmark
- Subscribe
- Mute
- Subscribe to RSS Feed
- Permalink
- Report Inappropriate Content
from online help (search line style, then select chart properties expressions)
Line Style
Click on Line Style in order to enter an attribute expression for calculating the line style for the line or line segment associated with the data point. This type of attribute expression only has effect on line, combo and radar charts.
The relative width of the line can be controlled by including a tag <Wn> where n is a multiplying factor to be applied on the default line width of the chart. The number n must be a real number between 0.5 and 8. Example: <W2.5>. The style of the line can be controlled by including a tag <Sn> where n is an integer between 1 and 4 indicating the style to be used (1=continuous, 2= dashed, 3=dotted, 4=dashed/dotted). Example: <S3>. The <Wn> and <Sn> tags can be freely combined, but only the first occurrence of each counts. The tags must be enclosed by single quotations.
- Mark as New
- Bookmark
- Subscribe
- Mute
- Subscribe to RSS Feed
- Permalink
- Report Inappropriate Content
Dear ,
Go to chart properties---> Expression tab

- Mark as New
- Bookmark
- Subscribe
- Mute
- Subscribe to RSS Feed
- Permalink
- Report Inappropriate Content
Line Style
Go to your expression and click on + sign
Select Line Stype and type any one from below
'<S1>'
'<S2>'
'<S3>'
'<S4>'
The style of the line can be controlled by including a tag <Sn> where
n is an integer between 1 and 4 indicating the style to be used (1=continuous,
2= dashed, 3=dotted, 4=dashed/dotted).
- Mark as New
- Bookmark
- Subscribe
- Mute
- Subscribe to RSS Feed
- Permalink
- Report Inappropriate Content
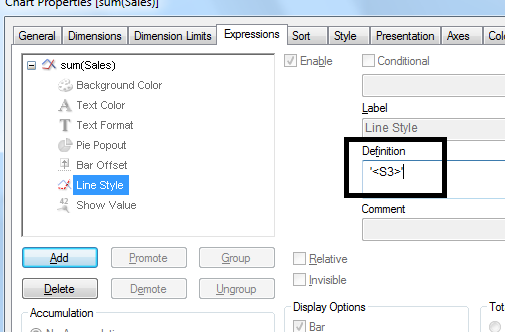
In Your expression click on + sign and write like
'<S1>' , '<S2>' , '<S3>' , '<S4>' ,
See the snap shot
- Mark as New
- Bookmark
- Subscribe
- Mute
- Subscribe to RSS Feed
- Permalink
- Report Inappropriate Content
from online help (search line style, then select chart properties expressions)
Line Style
Click on Line Style in order to enter an attribute expression for calculating the line style for the line or line segment associated with the data point. This type of attribute expression only has effect on line, combo and radar charts.
The relative width of the line can be controlled by including a tag <Wn> where n is a multiplying factor to be applied on the default line width of the chart. The number n must be a real number between 0.5 and 8. Example: <W2.5>. The style of the line can be controlled by including a tag <Sn> where n is an integer between 1 and 4 indicating the style to be used (1=continuous, 2= dashed, 3=dotted, 4=dashed/dotted). Example: <S3>. The <Wn> and <Sn> tags can be freely combined, but only the first occurrence of each counts. The tags must be enclosed by single quotations.