Unlock a world of possibilities! Login now and discover the exclusive benefits awaiting you.
- Qlik Community
- :
- All Forums
- :
- QlikView App Dev
- :
- Re: Value on data points different than expression...
- Subscribe to RSS Feed
- Mark Topic as New
- Mark Topic as Read
- Float this Topic for Current User
- Bookmark
- Subscribe
- Mute
- Printer Friendly Page
- Mark as New
- Bookmark
- Subscribe
- Mute
- Subscribe to RSS Feed
- Permalink
- Report Inappropriate Content
Value on data points different than expression result
Hello,
I have a graph with one dimension and 2 expressions:
Expression 1 = % of Open Invoice/Order
count({<STATUS = {'Open'}>} ID) / count(ID)
Expression 2 = % of Closed Invoice/Order
count({<STATUS = {'Closed'}>} ID) / count(ID)
I want to display in the bars, the count of Open Invoice/Order and Closed Invoice/Order.
I know how to do it when I have one expression but it does not work with multiple expressions. I tried the "show value" attribute of expressions but it only allows to decide if the value should be displayed or not, I cannot put a different calculation.
Anybody would know how I can achieve below result without changing the dimension/expression implementation?
Thanks,
jc
- Mark as New
- Bookmark
- Subscribe
- Mute
- Subscribe to RSS Feed
- Permalink
- Report Inappropriate Content
Hi,
Please find attached file for solution.
Regards,
Jagan.
- Mark as New
- Bookmark
- Subscribe
- Mute
- Subscribe to RSS Feed
- Permalink
- Report Inappropriate Content
Hello Jagan,
Unfortunately my real application is more complicated and I cannot add a second dimension to my graph.
Any other way to get what I am looking for?
Thanks,
jc
- Mark as New
- Bookmark
- Subscribe
- Mute
- Subscribe to RSS Feed
- Permalink
- Report Inappropriate Content
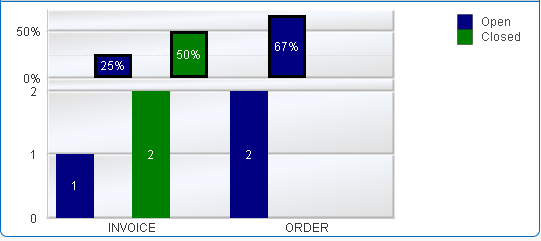
The only way I can see you achieving this is to add two more expressions that are the count of the closed and open and then split the Axis .. as attached
- Mark as New
- Bookmark
- Subscribe
- Mute
- Subscribe to RSS Feed
- Permalink
- Report Inappropriate Content
Hi,
I think it is not possible with 1 Dimension.
Regards,
Jagan.
- Mark as New
- Bookmark
- Subscribe
- Mute
- Subscribe to RSS Feed
- Permalink
- Report Inappropriate Content
please take a look at the example.
- Mark as New
- Bookmark
- Subscribe
- Mute
- Subscribe to RSS Feed
- Permalink
- Report Inappropriate Content
I do not think it is very readable.
If the graph behaviour is under total control, I thought of adding "Text in chart" on each bar. Otherwise I will need to review my dimension/expressions organization.
Thanks for trying guys.
- Mark as New
- Bookmark
- Subscribe
- Mute
- Subscribe to RSS Feed
- Permalink
- Report Inappropriate Content
The user wants the Y-axis to be in % but this is an interesting workaround.
- Mark as New
- Bookmark
- Subscribe
- Mute
- Subscribe to RSS Feed
- Permalink
- Report Inappropriate Content
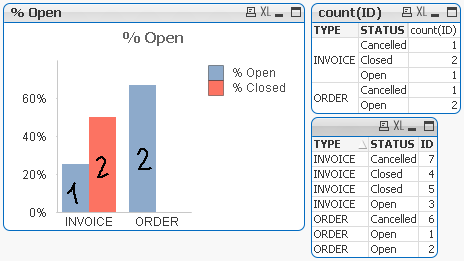
Hi,
Instead you can create two charts for showing % in one chart and numbers in another chart.
Regards,
jagan.
- Mark as New
- Bookmark
- Subscribe
- Mute
- Subscribe to RSS Feed
- Permalink
- Report Inappropriate Content
if you want both the numbers and % then you ca split axis in same chart to have both displays in two sections. top and bottom.