Unlock a world of possibilities! Login now and discover the exclusive benefits awaiting you.
- Qlik Community
- :
- All Forums
- :
- QlikView App Dev
- :
- Re: Pulling multiple fields with the same name fro...
- Subscribe to RSS Feed
- Mark Topic as New
- Mark Topic as Read
- Float this Topic for Current User
- Bookmark
- Subscribe
- Mute
- Printer Friendly Page
- Mark as New
- Bookmark
- Subscribe
- Mute
- Subscribe to RSS Feed
- Permalink
- Report Inappropriate Content
Pulling multiple fields with the same name from Excel?
Hello all,
I am currently trying to create multiple charts in QlikView using a set of tables in an Excel spreadsheet. Essentially, I need to create a chart that compares how many entries we actually had each month vs. the planned entries. For additional details on the QlikView chart I made, see this link (http://community.qlik.com/thread/116265).
The chart worked perfectly when I only loaded one table in the script. However, I need to be able to pull multiple tables that all have the same field names, but I need to be able to differentiate between different table data. Here is a picture to better show you what I mean:
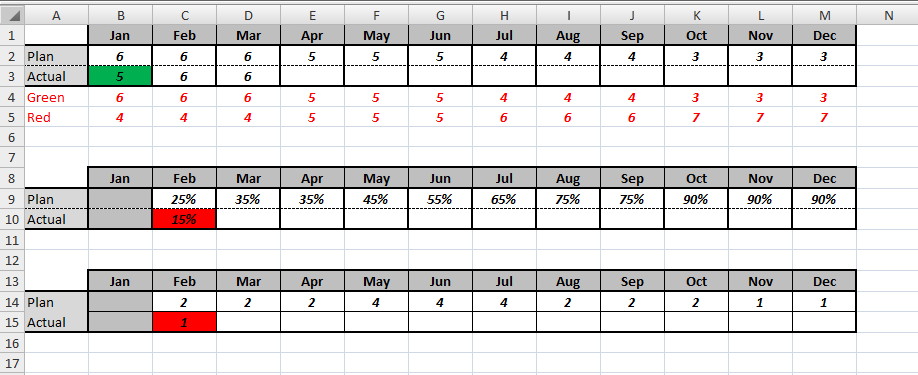
As you can see in the picture, there are 3 separate tables. Don't pay attention to the red/green row, they have been deleted since. Essentially, I need to be able to make a different chart for each of these tables (and eventually more). I had to transform these entries when loading the script of one particular table and ended up with the fields [Month], [Plan], and [Actual].
How can I pull this data in a way that I can separate/name the different value sets.
Thanks,
Pete
- Mark as New
- Bookmark
- Subscribe
- Mute
- Subscribe to RSS Feed
- Permalink
- Report Inappropriate Content
Load your table like
Table1:
Load [Month], [Plan], [Actual], 'Table1' as TableFlag from Location;
Concatenate
Table2:
Load [Month], [Plan], [Actual], 'Table2' as TableFlag from Location;
Concatenate
Table3:
Load [Month], [Plan], [Actual], 'Table3' as TableFlag from Location;
- Mark as New
- Bookmark
- Subscribe
- Mute
- Subscribe to RSS Feed
- Permalink
- Report Inappropriate Content
If the field names are the same in all three excel files and say they have a file name like Book2011, Book2012 and Book2013, then you can just read it by using wild characters and use the last four digits to distinguish where the data comes from.
ex:
AutoConcat:
LOAD *, Right(FileBaseName(),4) as Year
FROM
[Book*.xlsx]
(ooxml, embedded labels, table is Sheet1)
;
- Mark as New
- Bookmark
- Subscribe
- Mute
- Subscribe to RSS Feed
- Permalink
- Report Inappropriate Content
Is there any better way to select the tables rather than using the data transformation tool to manually mark all columns as garbage other than the ones I want? Also this makes it so that my first bar chart will change if you change the selection of TableFlag between Table1 and Table2. Is there any way to make one chart correspond to strictly one TableFlag selection no matter what? Thanks
- Mark as New
- Bookmark
- Subscribe
- Mute
- Subscribe to RSS Feed
- Permalink
- Report Inappropriate Content
Thanks but the problem with this is that all the tables will be within the same sheet of the same file as seen in the picture. Is there a work around for this?
- Mark as New
- Bookmark
- Subscribe
- Mute
- Subscribe to RSS Feed
- Permalink
- Report Inappropriate Content
You can (there are other ways) manually load in each table and name them differently. You can use the Qualify statement to differentiate between the fields in different tables. Using set analysis, you can use the qualified fields to calculate what you want.
Qualify statement - qualify and unqualify
-Greg
- Mark as New
- Bookmark
- Subscribe
- Mute
- Subscribe to RSS Feed
- Permalink
- Report Inappropriate Content
Do you mind attaching a sample file please.
- Mark as New
- Bookmark
- Subscribe
- Mute
- Subscribe to RSS Feed
- Permalink
- Report Inappropriate Content
Will this work?
-Greg
- Mark as New
- Bookmark
- Subscribe
- Mute
- Subscribe to RSS Feed
- Permalink
- Report Inappropriate Content
Hey guys, thanks for all the input. I actually found a much easier way to accomplish this. I used the Name Manager within Excel to name the ranges of the data I want. I can then reference these Named Regions within QlikView as separate tables. I made use of the "as" function within QlikView in order to separate the values (ie. They all had the field names Plan and Actual, but I changed it to a relevent name like SourcePlan and SourceActual for each table.)
Thanks again!
-Pete
- Mark as New
- Bookmark
- Subscribe
- Mute
- Subscribe to RSS Feed
- Permalink
- Report Inappropriate Content
Look in help at the Qualify function.
Bill
To help users find verified answers, please don't forget to use the "Accept as Solution" button on any posts that helped you resolve your problem or question.