Unlock a world of possibilities! Login now and discover the exclusive benefits awaiting you.
- Qlik Community
- :
- All Forums
- :
- QlikView App Dev
- :
- Re: How to suppress Nulls but not Zeros
- Subscribe to RSS Feed
- Mark Topic as New
- Mark Topic as Read
- Float this Topic for Current User
- Bookmark
- Subscribe
- Mute
- Printer Friendly Page
- Mark as New
- Bookmark
- Subscribe
- Mute
- Subscribe to RSS Feed
- Permalink
- Report Inappropriate Content
How to suppress Nulls but not Zeros
Hey all,
I am currently creating line charts based off of two values Plan and Actual. They will be pulling data from each month of the year. Essentially, I created the charts successfully by overlaying multiple charts over one another. However, the issue I am running into is the fact that some of the tables have null values (for months that have not been entered yet). I would like to suppress the entries that have no value entered (null), but I want to keep the entries with a value of 0. Is there any way to hide the null values? Here is a picture to better explain what I need to do:
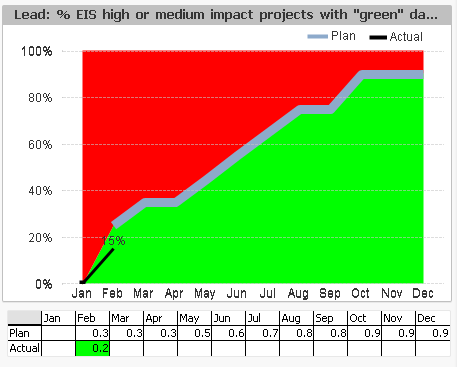
As you can see above, I have been using a background color expression to hide values below the Actual field to deal with nulls. Here is the expression I am using for background color: =if(below(EISDataQualityActual),color(1),red(0)) The only issue with this expression is that as you can see, it will not display the symbol for the current data points.
Anyone got any ideas?
Thanks,
Pete
- Mark as New
- Bookmark
- Subscribe
- Mute
- Subscribe to RSS Feed
- Permalink
- Report Inappropriate Content
maybe like
=if( not isnull(below(EISDataQualityActual)),color(1),red(0))
or
=if(below(EISDataQualityActual) or below(EISDataQualityActual)=0,color(1),red(0))
- Mark as New
- Bookmark
- Subscribe
- Mute
- Subscribe to RSS Feed
- Permalink
- Report Inappropriate Content
Neither of these seemed to solve it. For some reason I cant seem to get rid of line leading from Feb-Mar no matter what I do if I want to keep the symbol.