Unlock a world of possibilities! Login now and discover the exclusive benefits awaiting you.
- Qlik Community
- :
- All Forums
- :
- QlikView App Dev
- :
- Re: Use "Show/Hide" function in textbox
- Subscribe to RSS Feed
- Mark Topic as New
- Mark Topic as Read
- Float this Topic for Current User
- Bookmark
- Subscribe
- Mute
- Printer Friendly Page
- Mark as New
- Bookmark
- Subscribe
- Mute
- Subscribe to RSS Feed
- Permalink
- Report Inappropriate Content
Use "Show/Hide" function in textbox
Hi
Anyone who can tell me how to get the conditional section to work.
I have a pie-chart showing departments results, but if one department is having a negative result it's not shown in the pie-chart. But then I'd like a text box to appear letting know about it, and showing the departments name and results.
I've tried with a
sum(Profit)<0
but it sum all departments, it doesnt seem to take the dimension into consideration.
Anyone who know how I can check if one or more departments is having a negative result for the selected period?
Kind regards
Espen
- « Previous Replies
-
- 1
- 2
- Next Replies »
Accepted Solutions
- Mark as New
- Bookmark
- Subscribe
- Mute
- Subscribe to RSS Feed
- Permalink
- Report Inappropriate Content
Try in a text box like:
= 'List of departments with negetive Profit: ' & Concat( Aggr( If(Sum(Profit)<0, Departments) , Departments) , ',' )
- Mark as New
- Bookmark
- Subscribe
- Mute
- Subscribe to RSS Feed
- Permalink
- Report Inappropriate Content
Try in a text box like:
= 'List of departments with negetive Profit: ' & Concat( Aggr( If(Sum(Profit)<0, Departments) , Departments) , ',' )
- Mark as New
- Bookmark
- Subscribe
- Mute
- Subscribe to RSS Feed
- Permalink
- Report Inappropriate Content
Hi Espen,
Use Set analysis. You can use this expression
sum({<Department={'Dept_Name'}>}Profit)<0
for each department name you can check likewise, and whichever is negative, you can show it in a text box.
else in a text box you can aggregate for for all the departments with negative values, and concat them in text box only.
- Mark as New
- Bookmark
- Subscribe
- Mute
- Subscribe to RSS Feed
- Permalink
- Report Inappropriate Content
you can
1. use fabs() which will give you the absolute value and even the negative one can be visible and you can represent it in different color.
2. you can enable fast change (to straight table) in the PIE chart so that whenever customer wants to see the ones in negative can use fast change to see the straight table.
- Mark as New
- Bookmark
- Subscribe
- Mute
- Subscribe to RSS Feed
- Permalink
- Report Inappropriate Content
Concat(If(Aggr(Sum(Profit),Dept) < 0,Dept),',')
- Mark as New
- Bookmark
- Subscribe
- Mute
- Subscribe to RSS Feed
- Permalink
- Report Inappropriate Content
Hi
I suggest you to use bar chart, more appropriate for pos and neg values
brgs
- Mark as New
- Bookmark
- Subscribe
- Mute
- Subscribe to RSS Feed
- Permalink
- Report Inappropriate Content
Thanks, so many good answers and so fast!!
I just wonder, I used a pivot-table instead, but shouldn't it work the same way? I somehow seem to be left with the heading for the first column when the it should be all hidden.
Rgds
Espen
- Mark as New
- Bookmark
- Subscribe
- Mute
- Subscribe to RSS Feed
- Permalink
- Report Inappropriate Content
Yes, it should work similar way for heading/label as they(expressions) don't take dimensions into consideration.
- Mark as New
- Bookmark
- Subscribe
- Mute
- Subscribe to RSS Feed
- Permalink
- Report Inappropriate Content
 @
@
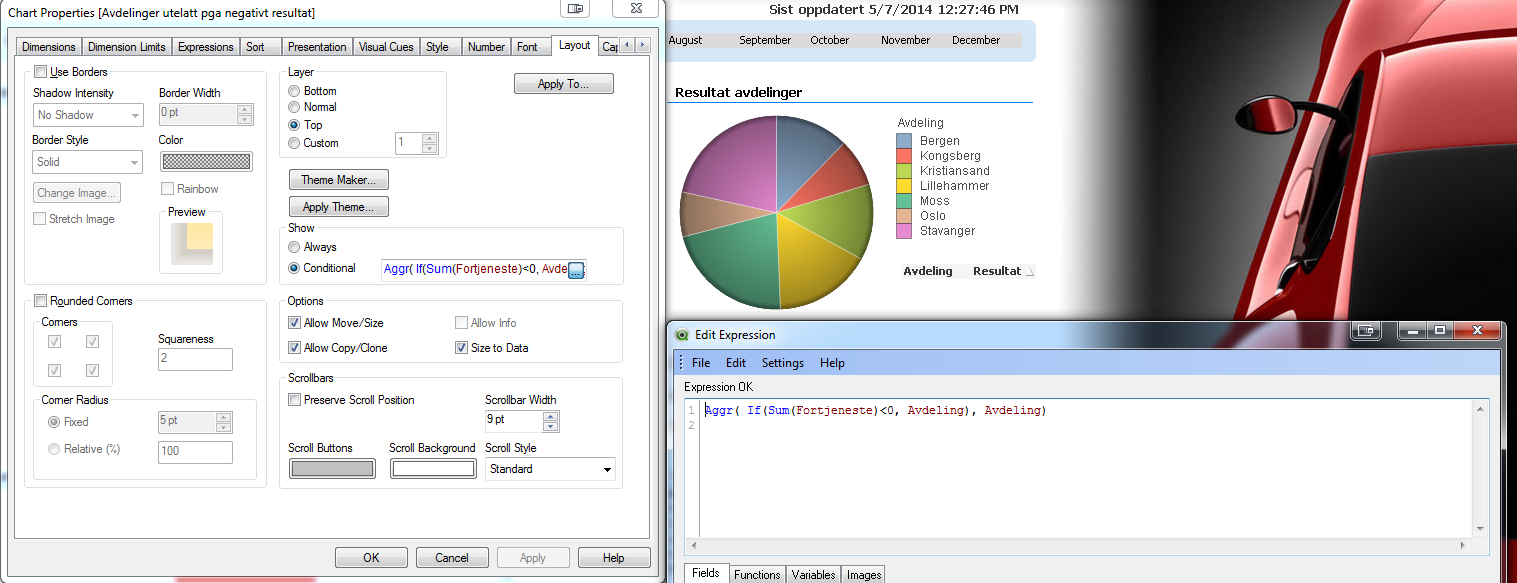
Can you spot what I-m doing wrong? You see the text down to the right of the circle saying "Avdeling" and "Resultat". It should be hidden now, but it isn't.
Rgds
Espen
- Mark as New
- Bookmark
- Subscribe
- Mute
- Subscribe to RSS Feed
- Permalink
- Report Inappropriate Content
Put a count() around your Agg(... in conditional expression, Like: =Count(Aggr(....))
- « Previous Replies
-
- 1
- 2
- Next Replies »