Unlock a world of possibilities! Login now and discover the exclusive benefits awaiting you.
- Qlik Community
- :
- All Forums
- :
- QlikView App Dev
- :
- Object in Demo
- Subscribe to RSS Feed
- Mark Topic as New
- Mark Topic as Read
- Float this Topic for Current User
- Bookmark
- Subscribe
- Mute
- Printer Friendly Page
- Mark as New
- Bookmark
- Subscribe
- Mute
- Subscribe to RSS Feed
- Permalink
- Report Inappropriate Content
Object in Demo
Hello everyone, I have seen from the site of QlikView demo "OEE Analysis" (http://eu-b.demo.qlik.com/detail.aspx?appName=OEE.qvw)
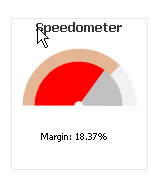
how do I know how you created the object semi-circle that is located in the dashboard (Overall Equipment Efficiency%)?
there is the possibility to download the demo, to analyze the object.
thanks
Andrea
- Mark as New
- Bookmark
- Subscribe
- Mute
- Subscribe to RSS Feed
- Permalink
- Report Inappropriate Content
Looks like a set of two gauge charts, both with angle span 180 degrees, with two sectors, with mode = fill to value.
Internal with cylinder thickness 0%, external with a bigger size and cylinder thickness some small number, or maybe just on the lower layer, behind the internal.
- Mark as New
- Bookmark
- Subscribe
- Mute
- Subscribe to RSS Feed
- Permalink
- Report Inappropriate Content
yes, 2 gauges, instead of fill to value I used segments setup
- Mark as New
- Bookmark
- Subscribe
- Mute
- Subscribe to RSS Feed
- Permalink
- Report Inappropriate Content
You should see this post where there is an explanation about the example http://community.qlik.com/blogs/qlikviewdesignblog/2014/05/09/dislike-gauge-charts-you-may-want-to-g...
- Mark as New
- Bookmark
- Subscribe
- Mute
- Subscribe to RSS Feed
- Permalink
- Report Inappropriate Content
Where can I find the OEE.qvw?
I would like to use the layout.
- Mark as New
- Bookmark
- Subscribe
- Mute
- Subscribe to RSS Feed
- Permalink
- Report Inappropriate Content
Hello Here's an example of how they are constructed files
http://community.qlik.com/blogs/qlikviewdesignblog/2014/05/09/dislike-gauge-charts-you-may-want-to-g...
the complete document QV example is not downloadable.