Unlock a world of possibilities! Login now and discover the exclusive benefits awaiting you.
- Qlik Community
- :
- All Forums
- :
- QlikView App Dev
- :
- Re: Need help in Bar Chart
- Subscribe to RSS Feed
- Mark Topic as New
- Mark Topic as Read
- Float this Topic for Current User
- Bookmark
- Subscribe
- Mute
- Printer Friendly Page
- Mark as New
- Bookmark
- Subscribe
- Mute
- Subscribe to RSS Feed
- Permalink
- Report Inappropriate Content
Need help in Bar Chart
Hi QV,
Is it possible to display total expression in a bar chart at the first bar?
Thanks,
Ananth
- Mark as New
- Bookmark
- Subscribe
- Mute
- Subscribe to RSS Feed
- Permalink
- Report Inappropriate Content
Hi Ananth,
Can you expalin little bit more about your need. Its not clear for me right now.
--jai
- Mark as New
- Bookmark
- Subscribe
- Mute
- Subscribe to RSS Feed
- Permalink
- Report Inappropriate Content
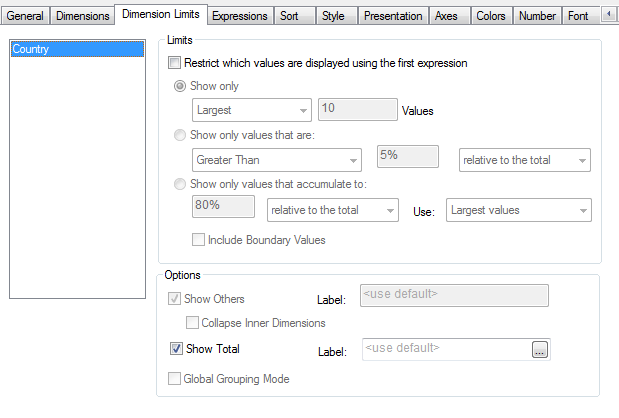
Yes, by the "Show Total" otion in the Dimension Limits pane.
- Mark as New
- Bookmark
- Subscribe
- Mute
- Subscribe to RSS Feed
- Permalink
- Report Inappropriate Content
Hi Jai,
Actually in the chart i am showing region wise performance year over year ( There are five region),i need to show one more bar which will be the total of all region's (sum of region values) year over year performance in the chart and the total bar should be in the first position of the bar chart. It means the total bar should be in the first position and then the separate region bar should display.
Thanks in advance.
- Mark as New
- Bookmark
- Subscribe
- Mute
- Subscribe to RSS Feed
- Permalink
- Report Inappropriate Content
Good evening!!! Thanks for your help,
But the total is coming at the last of the bar chart , i need to display it as first bar in the chart.
Thanks in advance
- Mark as New
- Bookmark
- Subscribe
- Mute
- Subscribe to RSS Feed
- Permalink
- Report Inappropriate Content
Hmmm, I’m not sure if that is possible. I tried it myself and QV keeps showing the total bar at the right hand side of the chart. Problem with showing a total in a bar chart is that the single measurements per dimension are hard to read. The bars of those single measurements can get too low because of the total bar. You can always show the total amount in the caption or in the chart title. Maybe that’s an acceptable solution?
There’s always an option to split the bar chart in two charts. One for the total and one for the underlying measurements. By using the same scale and fiddling with layers you should get the same result.
Cheers,
Michiel
- Mark as New
- Bookmark
- Subscribe
- Mute
- Subscribe to RSS Feed
- Permalink
- Report Inappropriate Content
Hi Ananth,
Unfortunately I don't think it is possible.
Cheers,
Carlos
- Mark as New
- Bookmark
- Subscribe
- Mute
- Subscribe to RSS Feed
- Permalink
- Report Inappropriate Content
HI Ananth,
In the properties-->sort tab, could you check with Numeric value as Ascending for the dimension Region
- Mark as New
- Bookmark
- Subscribe
- Mute
- Subscribe to RSS Feed
- Permalink
- Report Inappropriate Content
Have you tried using a text object showing the total? Then you can simply drag the text object on top of the chart and use layering to insure it is not hidden when the chart is clicked.
-Greg
- Mark as New
- Bookmark
- Subscribe
- Mute
- Subscribe to RSS Feed
- Permalink
- Report Inappropriate Content
Hi Goutam,
I tried that, even after its not working.