Unlock a world of possibilities! Login now and discover the exclusive benefits awaiting you.
- Qlik Community
- :
- All Forums
- :
- QlikView App Dev
- :
- Re: AGGR function changes the value after changing...
- Subscribe to RSS Feed
- Mark Topic as New
- Mark Topic as Read
- Float this Topic for Current User
- Bookmark
- Subscribe
- Mute
- Printer Friendly Page
- Mark as New
- Bookmark
- Subscribe
- Mute
- Subscribe to RSS Feed
- Permalink
- Report Inappropriate Content
AGGR function changes the value after changing the sorting table
Hi!
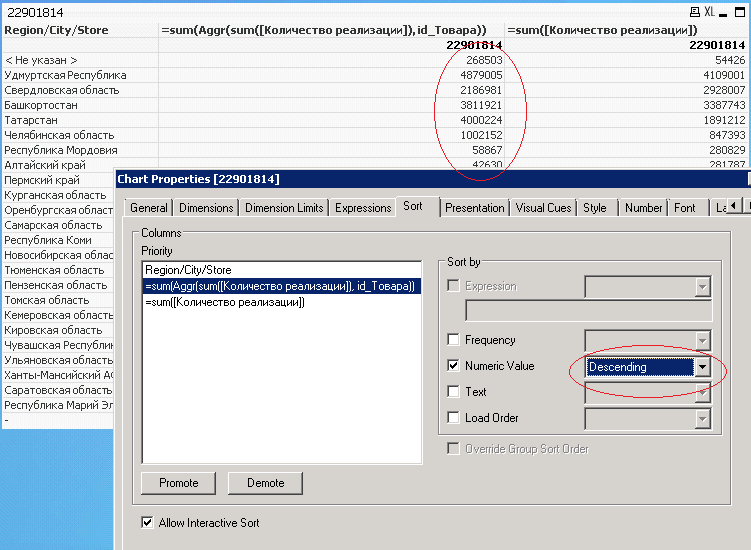
but
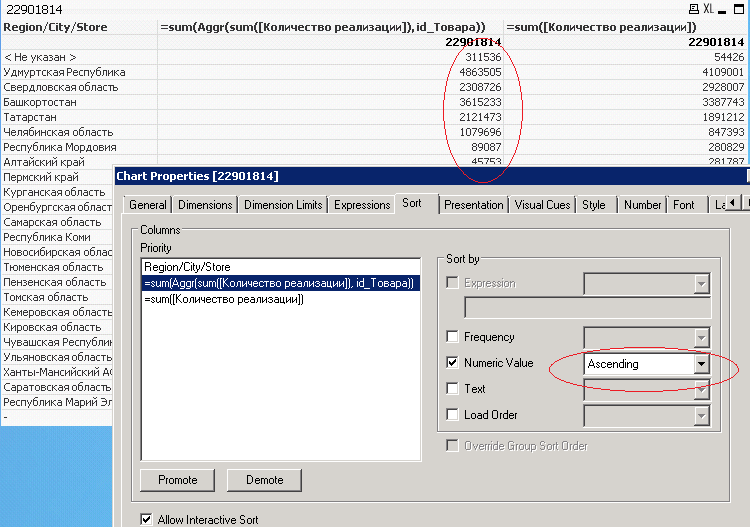
Bringing the total number remains the same 22901814.
What is it?
Accepted Solutions
- Mark as New
- Bookmark
- Subscribe
- Mute
- Subscribe to RSS Feed
- Permalink
- Report Inappropriate Content
Hi,
i'am not sure what is it, but try to add your chart dimension into aggr () dimensions.
And maybe you may share sample allowing us to replicate problem and have a closer look on it.
regards
Darek
- Mark as New
- Bookmark
- Subscribe
- Mute
- Subscribe to RSS Feed
- Permalink
- Report Inappropriate Content
The problem is surely related to your data association ...
- Mark as New
- Bookmark
- Subscribe
- Mute
- Subscribe to RSS Feed
- Permalink
- Report Inappropriate Content
Hi,
i'am not sure what is it, but try to add your chart dimension into aggr () dimensions.
And maybe you may share sample allowing us to replicate problem and have a closer look on it.
regards
Darek
- Mark as New
- Bookmark
- Subscribe
- Mute
- Subscribe to RSS Feed
- Permalink
- Report Inappropriate Content
Hi
The previous post is correct. The chart dimensions to the dimensions must be included in the dimensions in the aggr statement.
HTH
Jonathan
- Mark as New
- Bookmark
- Subscribe
- Mute
- Subscribe to RSS Feed
- Permalink
- Report Inappropriate Content
Yes, that's right.
=sum(Aggr(sum([Количество реализации])*FirstSortedValue([Цена закупки], -[Дата цены]), id_Товара, id_Магазина))
works as it should. thank you very much.