Unlock a world of possibilities! Login now and discover the exclusive benefits awaiting you.
- Qlik Community
- :
- All Forums
- :
- QlikView App Dev
- :
- Re: How to hide populated missing data
- Subscribe to RSS Feed
- Mark Topic as New
- Mark Topic as Read
- Float this Topic for Current User
- Bookmark
- Subscribe
- Mute
- Printer Friendly Page
- Mark as New
- Bookmark
- Subscribe
- Mute
- Subscribe to RSS Feed
- Permalink
- Report Inappropriate Content
How to hide populated missing data
My data set contains incidents opened by a service desk over the last 3 full months w/ month to date. When I first created the dashboard, I did not populate missing data and when certain selections were made, dates would disappear. In the new version I have populated missing data but when a date filter is applied (lets say the last 30 days) the dates go back the full 3 months. Do I need to use a calculated dimension to hide this data?
- « Previous Replies
-
- 1
- 2
- Next Replies »
Accepted Solutions
- Mark as New
- Bookmark
- Subscribe
- Mute
- Subscribe to RSS Feed
- Permalink
- Report Inappropriate Content
Hi, Nick
I think I've got the result
I just add additional expression like Only({$<CC_SDBU>}Visit_Date) and deselected Bar in options
PFA
Sergey
- Mark as New
- Bookmark
- Subscribe
- Mute
- Subscribe to RSS Feed
- Permalink
- Report Inappropriate Content
Hi Nick,
Please share a sample
Sergey
- Mark as New
- Bookmark
- Subscribe
- Mute
- Subscribe to RSS Feed
- Permalink
- Report Inappropriate Content
Hiya,
Are you using a Master Calendar at all? It should help with your "missing data" when date ranges are selected.
It also creates a good base for time selections (year, month, etc.) and point-in-time reporting (using set analysis for say ytd, mtd, same month last year, etc.).
- Mark as New
- Bookmark
- Subscribe
- Mute
- Subscribe to RSS Feed
- Permalink
- Report Inappropriate Content
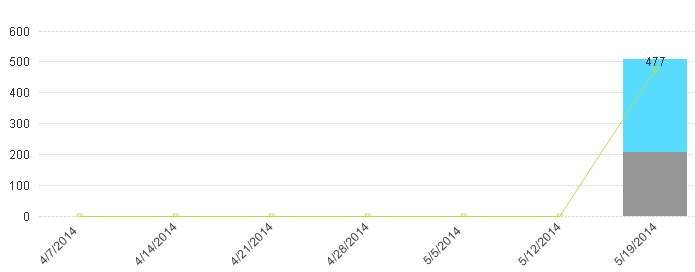
I am using a Master Calendar. My Master Calendar generates the dates for Incident_Created_Date and that field name is the same in the Master Calendar generation as it is in my data query. This is working great because I can select a product with no incidents opened on 5/19/2014 and a zero will appear on that date (dimension set to show all values) where previously (before populating missing data) the 5/19/2014 data point would disappear all together.
Now my issue is this, I'm populating missing data for the last 3 full months with month to date. I have buttons to apply a selection to the Incident_Created_Date to only show incidents in the last 7 days, 30 days, 60 days, 90 days, week to date, month to date, etc. After populating missing data the chart appears like the below (selection is week to date). The dates outside my selection (week to date) still appear and I want to hide them based on the selection.
- Mark as New
- Bookmark
- Subscribe
- Mute
- Subscribe to RSS Feed
- Permalink
- Report Inappropriate Content
Hi Nick,
Please share an example
Sergey
- Mark as New
- Bookmark
- Subscribe
- Mute
- Subscribe to RSS Feed
- Permalink
- Report Inappropriate Content
I'll work on switching the QVW to a sample dataset in the morning. Thanks!
- Mark as New
- Bookmark
- Subscribe
- Mute
- Subscribe to RSS Feed
- Permalink
- Report Inappropriate Content
See attached sample. I want my users to change the time frame using the available buttons (Last 7/14/30/90 Days) but the chart does not hide the dates outside the selection. If I disable "Show All Values" on the dimension they hide but then I lose the dates inside the time frame where there is no data.
- Mark as New
- Bookmark
- Subscribe
- Mute
- Subscribe to RSS Feed
- Permalink
- Report Inappropriate Content
anyone have ideas? this is my last hurdle before rolling out this dashboard.
- Mark as New
- Bookmark
- Subscribe
- Mute
- Subscribe to RSS Feed
- Permalink
- Report Inappropriate Content
So. If I uncheck Show all values for the dimension, it works 
But as I understand you want to see messing values within selected dates?
Sergey
- Mark as New
- Bookmark
- Subscribe
- Mute
- Subscribe to RSS Feed
- Permalink
- Report Inappropriate Content
With unchecked Show all values for the dimension and unchecked Presentation\Supress Zero-Values and Supress Missing everything works.
PFA an example - I deleted several values
Sergey
- « Previous Replies
-
- 1
- 2
- Next Replies »