Unlock a world of possibilities! Login now and discover the exclusive benefits awaiting you.
- Qlik Community
- :
- All Forums
- :
- QlikView App Dev
- :
- Re: charts
- Subscribe to RSS Feed
- Mark Topic as New
- Mark Topic as Read
- Float this Topic for Current User
- Bookmark
- Subscribe
- Mute
- Printer Friendly Page
- Mark as New
- Bookmark
- Subscribe
- Mute
- Subscribe to RSS Feed
- Permalink
- Report Inappropriate Content
charts
Hi
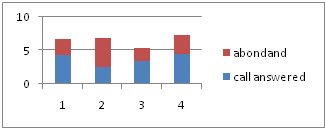
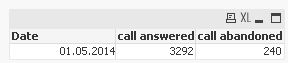
i have an excel and only have one row of value as shown in below image.. from the highlighted two columns i want to generate a chart as shown in the 2nd image.. i did try many ways but i just cant take the expected value.. can some one plz help me...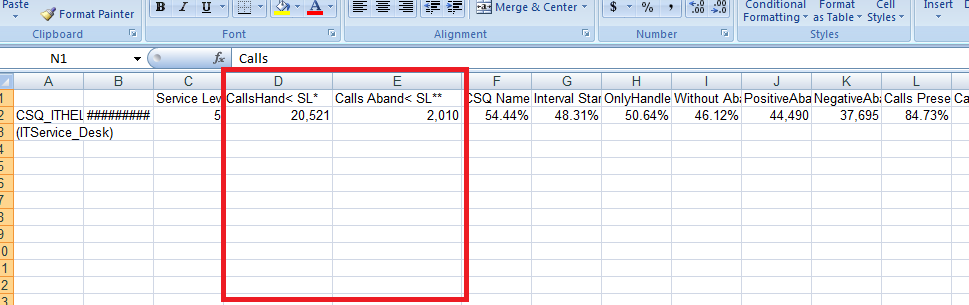
thank you in advance 
Accepted Solutions
- Mark as New
- Bookmark
- Subscribe
- Mute
- Subscribe to RSS Feed
- Permalink
- Report Inappropriate Content
Hi,
maybe like this?
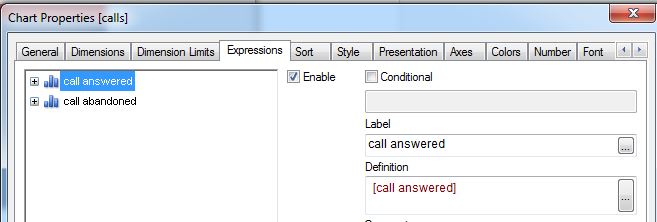
LOAD
F2 as Date,
[Calls
Hand
< SL*] as [call answered],
[Calls Aband
< SL**] as [call abandoned]
(biff, embedded labels, table is Sheet1$);

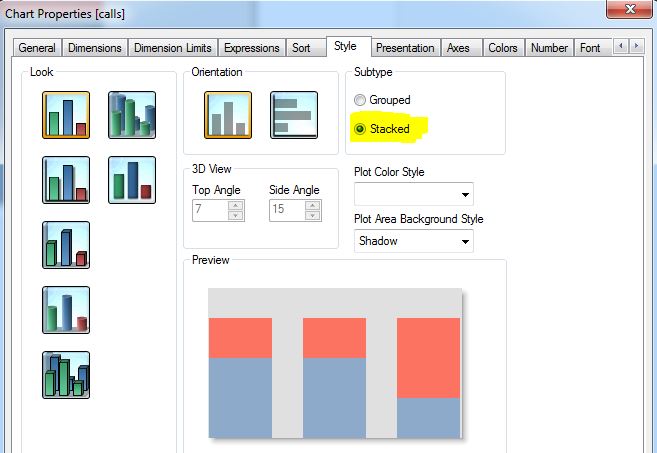
just select stacked bar chart:
hope this helps
regards
Marco
- Mark as New
- Bookmark
- Subscribe
- Mute
- Subscribe to RSS Feed
- Permalink
- Report Inappropriate Content
Hi,
Can you post your sample file with Excel data.
Regards
ASHFAQ
- Mark as New
- Bookmark
- Subscribe
- Mute
- Subscribe to RSS Feed
- Permalink
- Report Inappropriate Content
sorry 4 getting late this z the test quv n my excel.. i have done nothing actually in the quv cz i want to get this chart done
- Mark as New
- Bookmark
- Subscribe
- Mute
- Subscribe to RSS Feed
- Permalink
- Report Inappropriate Content
Hi,
maybe like this?
LOAD
F2 as Date,
[Calls
Hand
< SL*] as [call answered],
[Calls Aband
< SL**] as [call abandoned]
(biff, embedded labels, table is Sheet1$);
just select stacked bar chart:
hope this helps
regards
Marco
- Mark as New
- Bookmark
- Subscribe
- Mute
- Subscribe to RSS Feed
- Permalink
- Report Inappropriate Content
sorry for late reply but this worked perfectly thank you so much