Unlock a world of possibilities! Login now and discover the exclusive benefits awaiting you.
- Qlik Community
- :
- All Forums
- :
- Qlik NPrinting
- :
- Exclude basic filter in NPrinting when building re...
- Subscribe to RSS Feed
- Mark Topic as New
- Mark Topic as Read
- Float this Topic for Current User
- Bookmark
- Subscribe
- Mute
- Printer Friendly Page
- Mark as New
- Bookmark
- Subscribe
- Mute
- Subscribe to RSS Feed
- Permalink
- Report Inappropriate Content
Exclude basic filter in NPrinting when building reports, for line charts
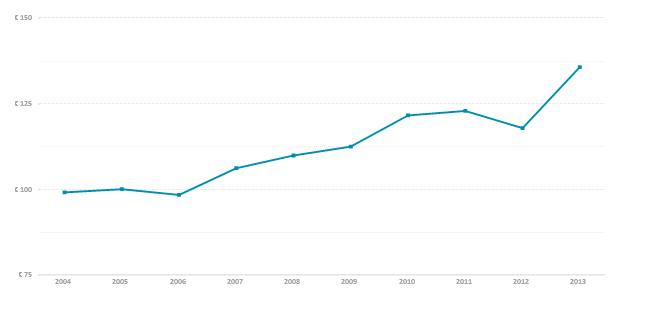
Through Nprinting I want to create a report with results for a given year and over multiple units, largely bar charts. Some objects, however, I don't present over a single year, but over several years. My basic filter in Nprinting however is set to date (2013) and thus the data of the units are only presented over 2013 (and not with the data over previous years). In a line chart, only the results of 2013, however, are shown.
How can I make this filter for a couple of line charts idle, so that all the years are presented? Thus no matter wat year has been selected.
- Mark as New
- Bookmark
- Subscribe
- Mute
- Subscribe to RSS Feed
- Permalink
- Report Inappropriate Content
In recent versions of NPrinting (15.4 and above), you can set filters on specific objects in an NPrinting - more info here: How to Apply a Specific Filter to Tables or Images – Customer Feedback for Vizubi
So you could apply your 2013 filter for your bar charts and then no filter for your line chart.
Alternatively you might be able to leave the 2013 filter on the report, but specify a Clear Selections Filter on the line chart.
Hope that helps!