Unlock a world of possibilities! Login now and discover the exclusive benefits awaiting you.
- Qlik Community
- :
- All Forums
- :
- QlikView App Dev
- :
- Re: Percent change in bar chart
- Subscribe to RSS Feed
- Mark Topic as New
- Mark Topic as Read
- Float this Topic for Current User
- Bookmark
- Subscribe
- Mute
- Printer Friendly Page
- Mark as New
- Bookmark
- Subscribe
- Mute
- Subscribe to RSS Feed
- Permalink
- Report Inappropriate Content
Percent change in bar chart
I have a bar chart which shows sales by year. Each bar is a simple Sum(Sales) expression.
As a value on the data point, I want to not only display the dollar amount, but also the percentage change from the last year.
So if my sales were: 2012 = 50, 2013 = 75, 2014 = 60, I'd want to see the following three values over each bar:
$50 / N/A $75 / +50% $60 / -20%
I have created a 2nd expression and disabled bar, kept show value on data point, but I'm not quite getting the right set analysis and formula to get the correct percentage to show.
Any ideas?
- Mark as New
- Bookmark
- Subscribe
- Mute
- Subscribe to RSS Feed
- Permalink
- Report Inappropriate Content
Try similar to the below expression to get both the % and $ amount in the chart
dual(Sum({<Date={'2012','2013','2014'}>}Sales)&' ('& num(Sum({<Date={'2012','2013','2014'}>}Sales)/Sum(sales),('##%'))& ')',
Sum({<Date={'2012','2013','2014'}>}Sales)+(Sum({<Date={'2012','2013','2014'}>}Sales))/100)
- Mark as New
- Bookmark
- Subscribe
- Mute
- Subscribe to RSS Feed
- Permalink
- Report Inappropriate Content
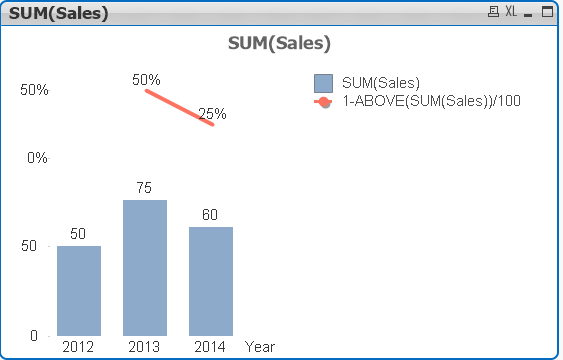
Do you mean like this
- Mark as New
- Bookmark
- Subscribe
- Mute
- Subscribe to RSS Feed
- Permalink
- Report Inappropriate Content
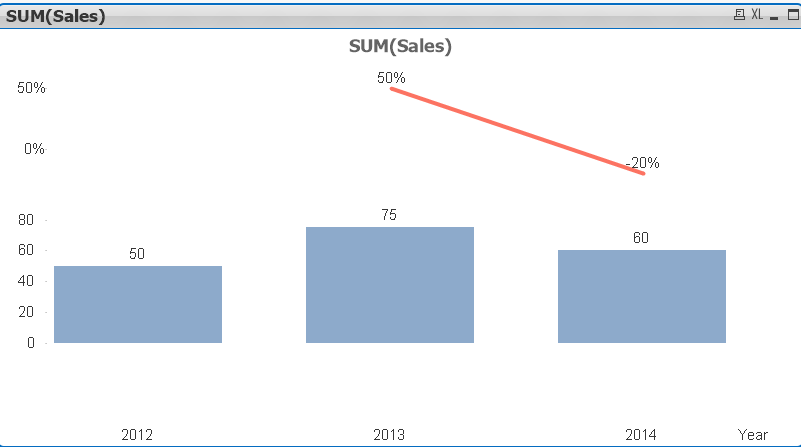
sorry I mean this
- Mark as New
- Bookmark
- Subscribe
- Mute
- Subscribe to RSS Feed
- Permalink
- Report Inappropriate Content
Close! I need the 50% and -20% to be next to the 75 and 60. But the formula you're using in that expression would probably be helpful!
- Mark as New
- Bookmark
- Subscribe
- Mute
- Subscribe to RSS Feed
- Permalink
- Report Inappropriate Content
You could use a combo chart. Make the bars your normal expression, then add an expression such as:
dual('$(=(1-above(sum(Sales))/100)),sum(sales))
Make this new expression a dot, and select show values on data points.
- Mark as New
- Bookmark
- Subscribe
- Mute
- Subscribe to RSS Feed
- Permalink
- Report Inappropriate Content
I have added that above, mark if helpful or correct
- Mark as New
- Bookmark
- Subscribe
- Mute
- Subscribe to RSS Feed
- Permalink
- Report Inappropriate Content
Thanks, all! It was the Above function that really de-mystified what I was trying to do!
- Mark as New
- Bookmark
- Subscribe
- Mute
- Subscribe to RSS Feed
- Permalink
- Report Inappropriate Content
No problem! Good luck