Unlock a world of possibilities! Login now and discover the exclusive benefits awaiting you.
- Qlik Community
- :
- All Forums
- :
- QlikView App Dev
- :
- Re: pie charts setting default color
- Subscribe to RSS Feed
- Mark Topic as New
- Mark Topic as Read
- Float this Topic for Current User
- Bookmark
- Subscribe
- Mute
- Printer Friendly Page
- Mark as New
- Bookmark
- Subscribe
- Mute
- Subscribe to RSS Feed
- Permalink
- Report Inappropriate Content
pie charts setting default color
hi
i have created a pie chart.. normally when we select one data value the pie chart becomes one individual color cz it represent only one value.. is there any possibility that i can fix the pie chart (normally when we select detach the pie chart values wont change/ move) but when i select a particular value except that particular segment, the other segments has to change in to a default color(ash color)
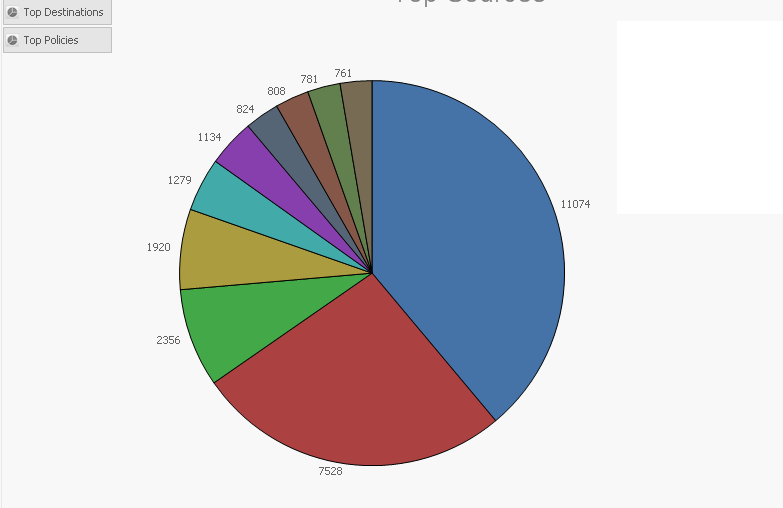
this image shows my present display 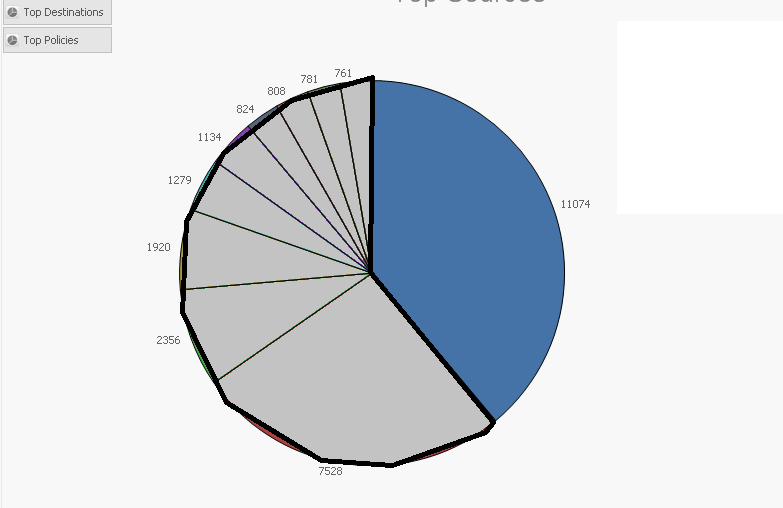 if i select the blue area with the value 11074 i want my pie chart to be displayed as the below image..
if some one can help me in this it would be really appreciated..
thank you in advance 
- « Previous Replies
- Next Replies »
Accepted Solutions
- Mark as New
- Bookmark
- Subscribe
- Mute
- Subscribe to RSS Feed
- Permalink
- Report Inappropriate Content
Right Click by chart\Properties..\Expressions\Click + near your expression\Background\
Please change the Customer in
=if(Customer=Customer, color(FieldIndex('Customer',Customer)), LightGray())
to your dimension field
Sergey
- Mark as New
- Bookmark
- Subscribe
- Mute
- Subscribe to RSS Feed
- Permalink
- Report Inappropriate Content
This technique, "Brushing", is covered in Stephen Redmond's excellent book "QlikView for Developers Cookbook"
http://www.amazon.com/QlikView-Developers-Cookbook-Stephen-Redmond/dp/1782179739/
Attached is an example for your specific question.
-Rob
- Mark as New
- Bookmark
- Subscribe
- Mute
- Subscribe to RSS Feed
- Permalink
- Report Inappropriate Content
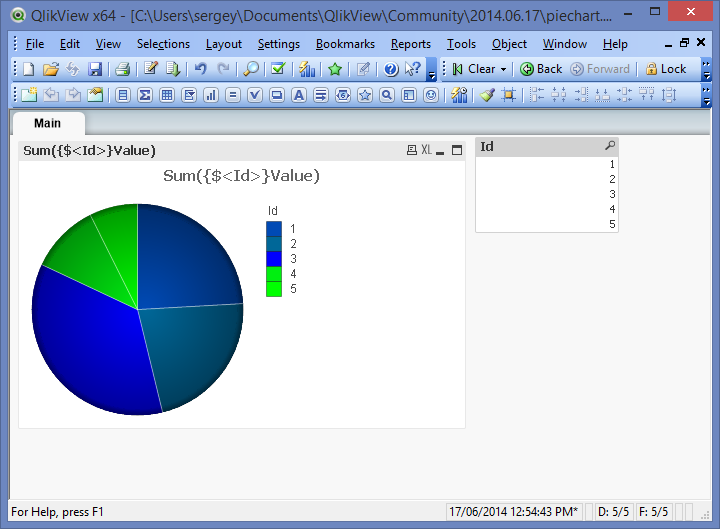
Hi,
PFA
I set background color for the expression in this way:
IF(GetSelectedCount(Id)<1,
ColorMix1 ((1+Sign(2*(sum(Value)-RangeMin (top(total sum(Value),1,NoOfRows(total))))/(RangeMax (top(total sum(Value),1,NoOfRows(total)))-RangeMin (top(total sum(Value),1,NoOfRows(total))))-1)*Sqrt(Fabs((2*(sum(Value)-RangeMin (top(total sum(Value),1,NoOfRows(total))))/(RangeMax (top(total sum(Value),1,NoOfRows(total)))-RangeMin (top(total sum(Value),1,NoOfRows(total))))-1))))/2, ARGB(255, 0, 255, 0), ARGB(255, 0,0, 255))
,IF(Match(GetFieldSelections(Id),Id)>=0,green(),RGB(179,179,179)))
Sergey
- Mark as New
- Bookmark
- Subscribe
- Mute
- Subscribe to RSS Feed
- Permalink
- Report Inappropriate Content
hi Rob
i tried doing it exactly the way the book said but with a pie chart not the line chart but it did not work 😕 and i am unable to view you .qvw file cz i am using a personal edition will it be possible for you to send me screen shots plz ??
- Mark as New
- Bookmark
- Subscribe
- Mute
- Subscribe to RSS Feed
- Permalink
- Report Inappropriate Content
hi Sergey
since i am using a personal edition i am unable to view you .qvw file. will it be possible for you to send me screen shots plzz??
- Mark as New
- Bookmark
- Subscribe
- Mute
- Subscribe to RSS Feed
- Permalink
- Report Inappropriate Content

- Mark as New
- Bookmark
- Subscribe
- Mute
- Subscribe to RSS Feed
- Permalink
- Report Inappropriate Content
hi Sergey
i tried the exact same thing but this did not work  is it cz my ID field contains a string value??
- Mark as New
- Bookmark
- Subscribe
- Mute
- Subscribe to RSS Feed
- Permalink
- Report Inappropriate Content
I don't think so.
Can you share your app?
Sergey
- Mark as New
- Bookmark
- Subscribe
- Mute
- Subscribe to RSS Feed
- Permalink
- Report Inappropriate Content
sorry Sergey due to office resources are been used i can not share the app.. 😕
- Mark as New
- Bookmark
- Subscribe
- Mute
- Subscribe to RSS Feed
- Permalink
- Report Inappropriate Content
oki i got this working but why dose it show all segments in black initially before i select any thing?? can't i show the segments with the same default colors without green??
- « Previous Replies
- Next Replies »