Unlock a world of possibilities! Login now and discover the exclusive benefits awaiting you.
- Qlik Community
- :
- All Forums
- :
- QlikView App Dev
- :
- Re: Re: Trouble charting data
- Subscribe to RSS Feed
- Mark Topic as New
- Mark Topic as Read
- Float this Topic for Current User
- Bookmark
- Subscribe
- Mute
- Printer Friendly Page
- Mark as New
- Bookmark
- Subscribe
- Mute
- Subscribe to RSS Feed
- Permalink
- Report Inappropriate Content
Trouble charting data
Hello --
I am a beginner to Qlik and I'm working on my first big dashboard project. I am creating a Productivity Variance dashboard for our finance /production teams.
They have asked for a series of graphs but also want the straight table data underneath to allow them to analyze the raw data they have drilled down on.
The specific problem I am having is that they would like to be able to chart the overall variance hours (std production hours vs. actual production hours) by Qtr, Month, Week, Customer, Part #, and any combination of these.
How would I go about doing this? I started out by creating individual charts and then grouping them in containers - but I get the problem that some of the charts say "No data to display" until I've drilled down to a certain level (say to a specific customer & part number).
My expression to gather this metric is fairly complex, and I'm wondering if that is my problem? In order to gather what I need, I have to do math against actual transacted qtys against the costs for the part, and then against the actual process hours reported for that workorder.
(((((If(Isnull(LABOR_LESS_SUBASSY_COST),LABORCOST,LABOR_LESS_SUBASSY_COST)/9.46)*60)) * Sum(TRANS_QUAN))-(((SUM(PROCESS_HOURS) * 60) / (SUM(TRANS_QUAN)))* Sum(TRANS_QUAN)))/60
I appreciate any and all help - and will gladly provide any more detail that is needed.
Thanks!
- Mark as New
- Bookmark
- Subscribe
- Mute
- Subscribe to RSS Feed
- Permalink
- Report Inappropriate Content
Hi joe
would it be possible to have a set of data and an example of graphs you need ?
best regards
Chris
- Mark as New
- Bookmark
- Subscribe
- Mute
- Subscribe to RSS Feed
- Permalink
- Report Inappropriate Content
Attached is the sample data.
I am loading 4 primary tables:
- Transactions - Has all the transactional data for work orders
- Costs - Has all the labor costs for parts
- Labor Hours - Has the labor hours reported for a work order
- Customer - Has the customer name linked to the part number
Transactions.Part_ID -> Costs.Part_ID
Transactions.Workorder_ID -> Labor Hours.WorkOrder_ID
Transactions.Part_ID -> Customer.Part_ID
In order to calculate my standard labor minutes for a part, I have to perform math against the cost. We're only trying to capture the productivity at the top level, so if the part has a sub-assembly I need to use the labor cost less the subassembly. If the part does not have a sub assembly I use just its labor cost.
The formula I am using looks like this for that:
If(isnull(laborcost_lesssubassembly),laborcost,laborcost_lesssubassembly))/$9.46)*60
This formula should give me the calculated labor std minute for a part based on its labor cost (the 9.46 is a standard labor dollar amount that I made up for this sample)
Then in order to calculate the actual labor hours spend on a part, I need to summarize the transactions and labor hours for the work order/part and then multiply them by each other to get the actual reported time.
So:
Actual labor minutes: Sum(Transactions.Trans_Qty) * Sum(Labor Hours.Process_Hrs)*60
Difference back in hours: (If(isnull(laborcost_lesssubassembly),laborcost,laborcost_lesssubassembly))/$9.46)*60) - (Sum(Transactions.Trans_Qty) * Sum(Labor Hours.Process_Hrs)*60) / 60
Now - I need this data (the difference) to be bar charted by Qtr, Month, Week, Customer, Part, Customer/Part.
Does this help you?
- Mark as New
- Bookmark
- Subscribe
- Mute
- Subscribe to RSS Feed
- Permalink
- Report Inappropriate Content
Joe,
to answer your first question "No data to display"
change in your formula 9.46 by 9,46 comma instead of dot
Chris
- Mark as New
- Bookmark
- Subscribe
- Mute
- Subscribe to RSS Feed
- Permalink
- Report Inappropriate Content
Joe
to get Month, Week, quater, year
Transaction:
LOAD Part_ID,
Part_No,
Revision,
WorkOrder_ID,
Trans_Date,
year(Trans_Date) as Trans_Year,
Month(Trans_Date) as Trans_Month,
ceil(num(Month(Trans_Date))/3) as Trans_quarter,
week(Trans_Date) as Trans_Week,
Trans_Qty,
LotNo
FROM
SampleData.xlsx
(ooxml, embedded labels, table is Transactions);
best regards
Chris
- Mark as New
- Bookmark
- Subscribe
- Mute
- Subscribe to RSS Feed
- Permalink
- Report Inappropriate Content
Hi christianj --
I have no trouble loading the data, and it seems to come together fine.
The trouble I am having is getting the data to chart correctly.
Because I have to first summarize all the transactions for a given workorder/part id/rev - it's not calculating my labor times it seems?
- Mark as New
- Bookmark
- Subscribe
- Mute
- Subscribe to RSS Feed
- Permalink
- Report Inappropriate Content
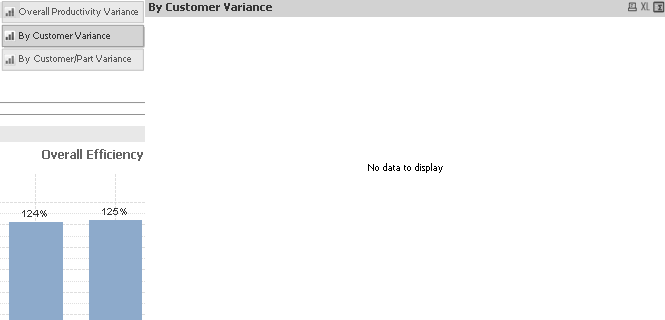
For example - I can create the chart when I include Workorder_ID, Part, and Customer as dimensions. But when I try to summarize down to just customer or a date, "No data to display"
Example:
Working:
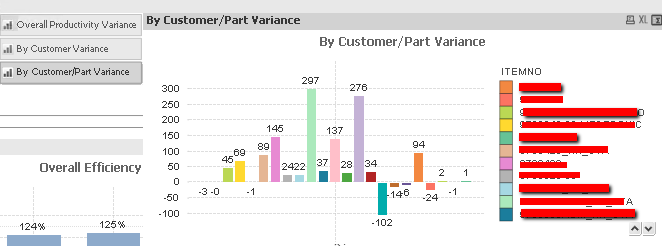
Not working:
- Mark as New
- Bookmark
- Subscribe
- Mute
- Subscribe to RSS Feed
- Permalink
- Report Inappropriate Content
I've found that if I narrow down my selection to a customer and a part, the "customer" variance graphs. But until I drill down to that point, it's "No data to display"
- Mark as New
- Bookmark
- Subscribe
- Mute
- Subscribe to RSS Feed
- Permalink
- Report Inappropriate Content
Does anyone have any suggestions? I cannot get this to chart by just 1 dimension. Only when I have both.
What would this indicate? If this is a newbie question, I apologize.