Unlock a world of possibilities! Login now and discover the exclusive benefits awaiting you.
- Qlik Community
- :
- All Forums
- :
- QlikView App Dev
- :
- Re: Exclude 0 and -1 from a chart
- Subscribe to RSS Feed
- Mark Topic as New
- Mark Topic as Read
- Float this Topic for Current User
- Bookmark
- Subscribe
- Mute
- Printer Friendly Page
- Mark as New
- Bookmark
- Subscribe
- Mute
- Subscribe to RSS Feed
- Permalink
- Report Inappropriate Content
Exclude 0 and -1 from a chart
Hello everyone,
I have a graph with several expressions made with sets analysis. Their aims is to display a percent of type of lines compare to the rest of the other lines.
My problem is that I obtain values "-1" and "0" in my dimension. These values doesn't exists at origin in my table.
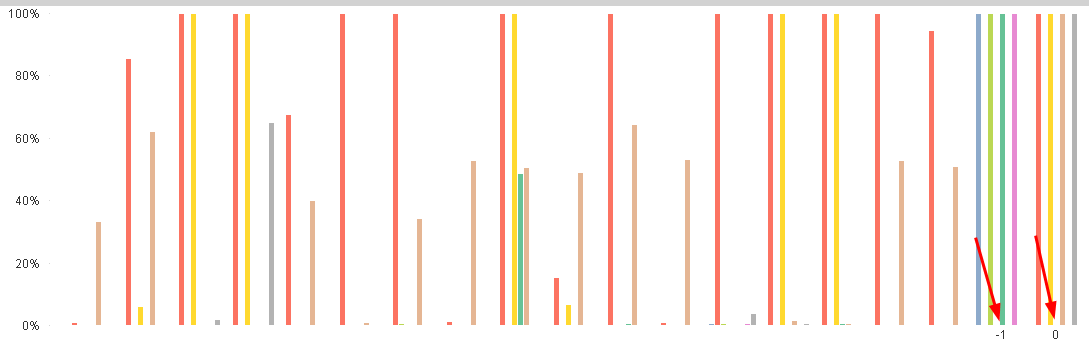
Do you know how I can hide these -1 and 0 ?
Thank you ! 
Accepted Solutions
- Mark as New
- Bookmark
- Subscribe
- Mute
- Subscribe to RSS Feed
- Permalink
- Report Inappropriate Content
if your expression is something like MYEXPR then
write:
if(MYEXPR <= 0, null(), MYEXPR )
let me know
- Mark as New
- Bookmark
- Subscribe
- Mute
- Subscribe to RSS Feed
- Permalink
- Report Inappropriate Content
if your expression is something like MYEXPR then
write:
if(MYEXPR <= 0, null(), MYEXPR )
let me know
- Mark as New
- Bookmark
- Subscribe
- Mute
- Subscribe to RSS Feed
- Permalink
- Report Inappropriate Content
if(dimension_name<>'-1' and dimensionn_name<>'0' , dimension_name,0)
- Mark as New
- Bookmark
- Subscribe
- Mute
- Subscribe to RSS Feed
- Permalink
- Report Inappropriate Content
if(column(1)< 0, null(), column(1))
here column(1)----> denotes first expression you can use column(N)-->n=1,2,3.......
and go to chart -> properties-> presentation-> supress zero value
hope this helps
- Mark as New
- Bookmark
- Subscribe
- Mute
- Subscribe to RSS Feed
- Permalink
- Report Inappropriate Content
Can you please share your qvw to better explain what you want to achieve?
- Mark as New
- Bookmark
- Subscribe
- Mute
- Subscribe to RSS Feed
- Permalink
- Report Inappropriate Content
you can also do below
go to excess and in static min write 1
hope this helps
- Mark as New
- Bookmark
- Subscribe
- Mute
- Subscribe to RSS Feed
- Permalink
- Report Inappropriate Content
Thanks for your responses !