Unlock a world of possibilities! Login now and discover the exclusive benefits awaiting you.
- Qlik Community
- :
- All Forums
- :
- QlikView App Dev
- :
- Re: Designing a two dimensional table
- Subscribe to RSS Feed
- Mark Topic as New
- Mark Topic as Read
- Float this Topic for Current User
- Bookmark
- Subscribe
- Mute
- Printer Friendly Page
- Mark as New
- Bookmark
- Subscribe
- Mute
- Subscribe to RSS Feed
- Permalink
- Report Inappropriate Content
Designing a two dimensional table
Hey Guys!
with your help i have designed most of the dashboard i needed. I owe you so much and I don't know how to thank you for your support.
the only thing that is left is a two dimensional table which has 12 columns (number of questions in the data model) and 32 rows (number of cities).
there are 2 things that i don't know how to create:
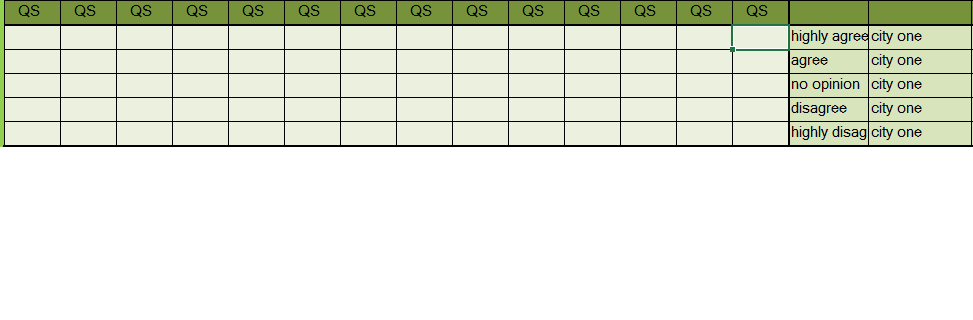
1- the table structure itself ( since the question has 5 possible answers {highly agree,agree,highly disagree, no opinion} when i chose the questions for dimension it shows the possible answers : {highly agree,agree,highly disagree, no opinion} , but l want to have the percentage of people who are {highly agree,agree,highly disagree, no opinion} in all cities .
2- the way i should script to count the all the people who are {highly agree,agree,highly disagree, no opinion} in one city so i can calculate the percentage.
as you can see in the picture below, i have to have 5 row for each city to see the percentage of each possible answer. i guess it's a little tricky..isn't it?
what would you do to show the results?
thank you again 
- Mark as New
- Bookmark
- Subscribe
- Mute
- Subscribe to RSS Feed
- Permalink
- Report Inappropriate Content
Hi,
actually there are 3 dimensions:
- City
- Questions
- Answers
You should consider using a Pivot Table
With the dimensions City and Questions and for expresion a count of each possibility and marking it as relative.
Ex: Count({<Answer='highly agree'>}Answer)
- Mark as New
- Bookmark
- Subscribe
- Mute
- Subscribe to RSS Feed
- Permalink
- Report Inappropriate Content
Dear Juan, Thanks for your instant reply.
would you please be more detailed on this. what is the script to count the number of each answer where city is one,two..etc.
i mean how can i fill the table shown in the question?
thanks buddy