Unlock a world of possibilities! Login now and discover the exclusive benefits awaiting you.
- Qlik Community
- :
- All Forums
- :
- QlikView App Dev
- :
- Re: displaying negative values in Gauge chart
- Subscribe to RSS Feed
- Mark Topic as New
- Mark Topic as Read
- Float this Topic for Current User
- Bookmark
- Subscribe
- Mute
- Printer Friendly Page
- Mark as New
- Bookmark
- Subscribe
- Mute
- Subscribe to RSS Feed
- Permalink
- Report Inappropriate Content
displaying negative values in Gauge chart
hi
i am trying to show minus values in Gauge chart. at present i am displaying the positive values as the below shown image (which is in blue)
is there any way of showing the minus (negative) values as shown in the second image(shown in orange)??
if some one could help me in this i really would appreciate... thank you in advance 


- Mark as New
- Bookmark
- Subscribe
- Mute
- Subscribe to RSS Feed
- Permalink
- Report Inappropriate Content
Maybe try using the fabs() function. This will convert the negative value to a positive one so that the chart will render. You can then make the color in the Presentation tab a Calculated color, aqua for positive and orange for negative.
Hope this helps.
- Mark as New
- Bookmark
- Subscribe
- Mute
- Subscribe to RSS Feed
- Permalink
- Report Inappropriate Content
Here is an example.
- Mark as New
- Bookmark
- Subscribe
- Mute
- Subscribe to RSS Feed
- Permalink
- Report Inappropriate Content
hi mphekin12
i am using a personal edition. will you be able to send me some screen shots plzz 
- Mark as New
- Bookmark
- Subscribe
- Mute
- Subscribe to RSS Feed
- Permalink
- Report Inappropriate Content
In Presentation tab give minimum guage setting as -1 and maximum as 1
- Mark as New
- Bookmark
- Subscribe
- Mute
- Subscribe to RSS Feed
- Permalink
- Report Inappropriate Content
Hi, Try below,
Segment 1 = 0%
Segment 1 Color = Orange
Segment 2 = 85%
Segment 2 Color = Transparent
Center Angle = 75 degree
Angle Span = 360 degree
PS: Your expression should be 1 i.e 100% always otherwise this will not work.
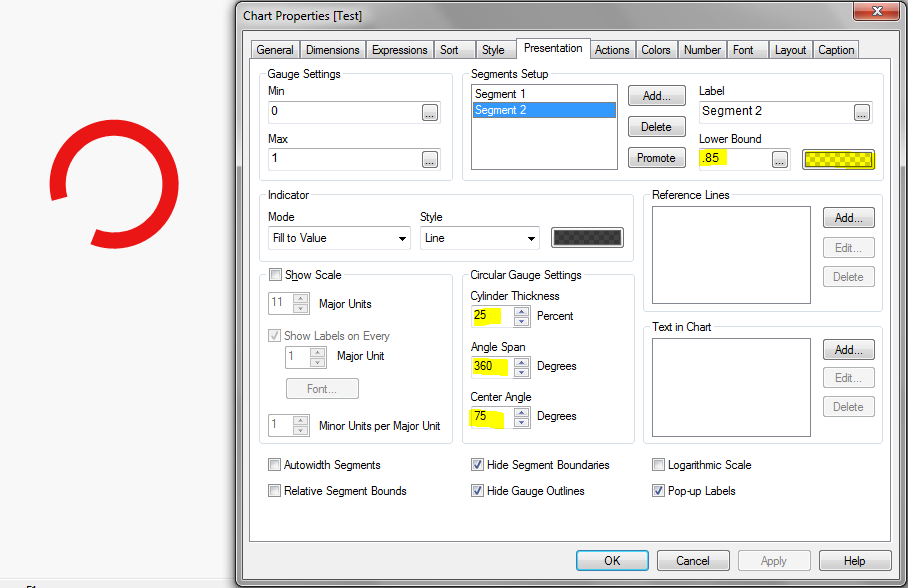
Hope this helps you
- Mark as New
- Bookmark
- Subscribe
- Mute
- Subscribe to RSS Feed
- Permalink
- Report Inappropriate Content
the thin is i am am taking the value from an equation
=if(F=0,
num((sum( Actual)
)
/
sum( Budget),'##0.##'&'%'),
num((sum( FinActual)
)
/
sum( Budget),'##0.##'&'%'))
the positive values can be seen but not the negative values 
- Mark as New
- Bookmark
- Subscribe
- Mute
- Subscribe to RSS Feed
- Permalink
- Report Inappropriate Content
Will this screen shot work for you?