Unlock a world of possibilities! Login now and discover the exclusive benefits awaiting you.
- Qlik Community
- :
- All Forums
- :
- QlikView App Dev
- :
- Plot NULL values as zero
- Subscribe to RSS Feed
- Mark Topic as New
- Mark Topic as Read
- Float this Topic for Current User
- Bookmark
- Subscribe
- Mute
- Printer Friendly Page
- Mark as New
- Bookmark
- Subscribe
- Mute
- Subscribe to RSS Feed
- Permalink
- Report Inappropriate Content
Plot NULL values as zero
This is kind of a two-part question. You can see from the first image below that weeks 12, 14, and 16 are NULL values and have been skipped. In the second chart, I unchecked the value to "Supress Zero-Values". We are currently in week 22 and I would like to show the NULL values <= current week as zero. But, I would also like to hide/suppress the NULL values betond week 22. It seems that I can't have it both ways. I even tried to change the background color to white for these week values, but was unable to get it to work.
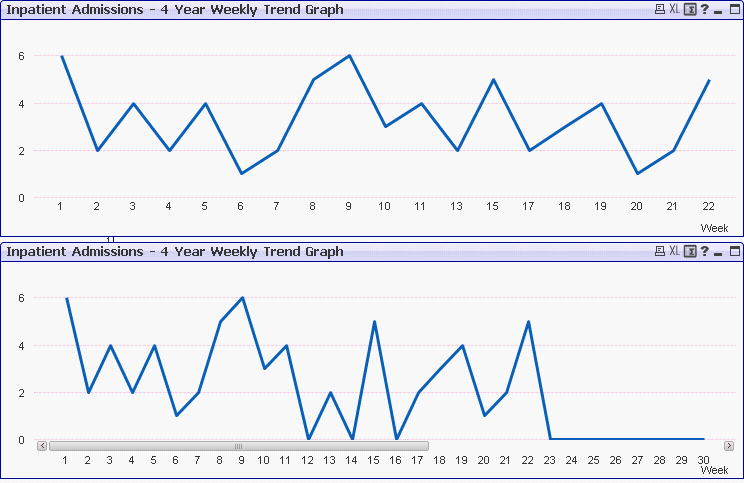
Are there any suggestions to get this working as I described above?
Thanks,
Dan
- Mark as New
- Bookmark
- Subscribe
- Mute
- Subscribe to RSS Feed
- Permalink
- Report Inappropriate Content
Leave "Suppress Zero-Values" unchecked and add to your set analysis {$<[week] <= **current week**>} for your chart's equation
Depending on how you determine the number of the week, you could use the Now() function perhaps.
- Mark as New
- Bookmark
- Subscribe
- Mute
- Subscribe to RSS Feed
- Permalink
- Report Inappropriate Content
Doesn’t seem to work using set analysis. The weeks beyond current week still show with zero values.
- Mark as New
- Bookmark
- Subscribe
- Mute
- Subscribe to RSS Feed
- Permalink
- Report Inappropriate Content
I've actually been playing around with the "Suppress Zero-Values" button on one of my own projects and it does seem to be doing some strange, incomprehensible things. This thread (Re: Suppress zero values in Tables/Charts) makes me think this functionality is slightly broken.
- Mark as New
- Bookmark
- Subscribe
- Mute
- Subscribe to RSS Feed
- Permalink
- Report Inappropriate Content
Can you please share the qvw file?
- Mark as New
- Bookmark
- Subscribe
- Mute
- Subscribe to RSS Feed
- Permalink
- Report Inappropriate Content
Hi Dan,
Define a static max at the axes tab on your graph properties.
If you have a variable that calculates the current week, it should look like this:
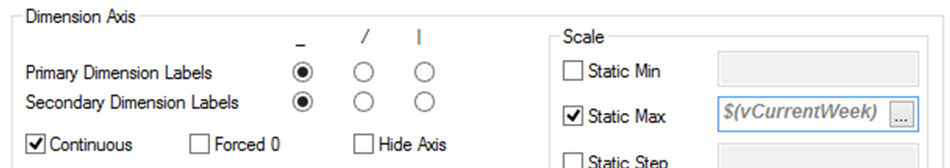
Best regards.