Unlock a world of possibilities! Login now and discover the exclusive benefits awaiting you.
- Qlik Community
- :
- All Forums
- :
- QlikView App Dev
- :
- Re: How do I create this particular Qlikview chart...
- Subscribe to RSS Feed
- Mark Topic as New
- Mark Topic as Read
- Float this Topic for Current User
- Bookmark
- Subscribe
- Mute
- Printer Friendly Page
- Mark as New
- Bookmark
- Subscribe
- Mute
- Subscribe to RSS Feed
- Permalink
- Report Inappropriate Content
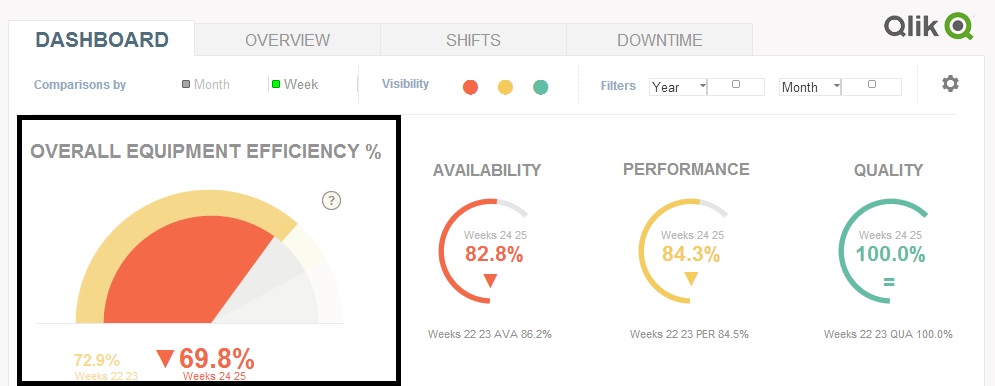
How do I create this particular Qlikview chart?
Hi there,
I came across the chart (highlighted in the black box) below at the qv demos website (QlikView), and was wondering how I could create it? Any help would be useful. Thanks in advance.
- Tags:
- new_to_qlikview
Accepted Solutions
- Mark as New
- Bookmark
- Subscribe
- Mute
- Subscribe to RSS Feed
- Permalink
- Report Inappropriate Content
It's actually 2 gauge charts - with a larger one below and smaller on top.
There's more information here that might help with creating them:
http://community.qlik.com/docs/DOC-4758
Let us know if you need any more help though.
- Mark as New
- Bookmark
- Subscribe
- Mute
- Subscribe to RSS Feed
- Permalink
- Report Inappropriate Content
Hi,
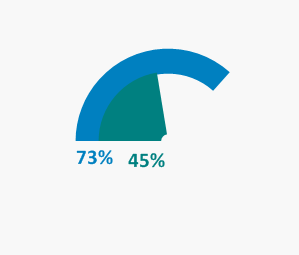
You can create this kind of chart using gauge chart
by editing the style and layout of gauge chart u will be able to create chart like this
i tried creating a chart like this
have a look
- Mark as New
- Bookmark
- Subscribe
- Mute
- Subscribe to RSS Feed
- Permalink
- Report Inappropriate Content
Hi can you share your project file? I still can't seem to be able to do it.
- Mark as New
- Bookmark
- Subscribe
- Mute
- Subscribe to RSS Feed
- Permalink
- Report Inappropriate Content
HI New_Qliker ,
You must create these kind of charts with gauge charts only ..
and you have you use some style and colors and for formats ...
it should be tried by yourself checking each options in chart properties..
Go through this also :
- Mark as New
- Bookmark
- Subscribe
- Mute
- Subscribe to RSS Feed
- Permalink
- Report Inappropriate Content
It's actually 2 gauge charts - with a larger one below and smaller on top.
There's more information here that might help with creating them:
http://community.qlik.com/docs/DOC-4758
Let us know if you need any more help though.
- Mark as New
- Bookmark
- Subscribe
- Mute
- Subscribe to RSS Feed
- Permalink
- Report Inappropriate Content
Thanks. Finally got it!