Unlock a world of possibilities! Login now and discover the exclusive benefits awaiting you.
- Qlik Community
- :
- All Forums
- :
- QlikView App Dev
- :
- Re: Data Table below Bar Chart
- Subscribe to RSS Feed
- Mark Topic as New
- Mark Topic as Read
- Float this Topic for Current User
- Bookmark
- Subscribe
- Mute
- Printer Friendly Page
- Mark as New
- Bookmark
- Subscribe
- Mute
- Subscribe to RSS Feed
- Permalink
- Report Inappropriate Content
Data Table below Bar Chart
Hello,
is it possible to add a Data Table (like in Excel) below a Bar Chart in QV?
I got a Bar Chart with the most important values, but I also need some more data to visualize in the same chart.
By now, I only got an extra Table Chart to show the extra data.
Thanks a lot in advance!
Alexander
Accepted Solutions
- Mark as New
- Bookmark
- Subscribe
- Mute
- Subscribe to RSS Feed
- Permalink
- Report Inappropriate Content
You can obviously create a bar chart and a straight or pivot table but direct result like excel is not possible.
- Mark as New
- Bookmark
- Subscribe
- Mute
- Subscribe to RSS Feed
- Permalink
- Report Inappropriate Content
Hi,
Could you attach screenshot of your requirement.
You may add expressions, disable "Bar" display option and enable "Text on axis" option.
- Mark as New
- Bookmark
- Subscribe
- Mute
- Subscribe to RSS Feed
- Permalink
- Report Inappropriate Content

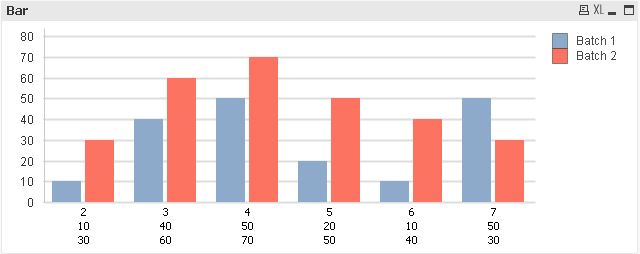
I need a simple Table like that below my bar chart. I also want to visualize data in this Table, which is not shown in the bar chart. It looks much better, when the table is directly connected to the chart than with two independent charts.
- Mark as New
- Bookmark
- Subscribe
- Mute
- Subscribe to RSS Feed
- Permalink
- Report Inappropriate Content
Don't think so this is possible in QliKView Bar Chart...
- Mark as New
- Bookmark
- Subscribe
- Mute
- Subscribe to RSS Feed
- Permalink
- Report Inappropriate Content
See the Attachment.
Regards
Aviral Nag
- Mark as New
- Bookmark
- Subscribe
- Mute
- Subscribe to RSS Feed
- Permalink
- Report Inappropriate Content
Hi,
Definitely, you can't get exact view but you may do some work around to achieve this. Some thing like below, you can even add lines by using text in chart option or have background image which will fit in box etc.
Attached qvw for your reference.
- Mark as New
- Bookmark
- Subscribe
- Mute
- Subscribe to RSS Feed
- Permalink
- Report Inappropriate Content
Thank you both,
so there is no possibility to do it like in Excel right?
Regards,
Alex
- Mark as New
- Bookmark
- Subscribe
- Mute
- Subscribe to RSS Feed
- Permalink
- Report Inappropriate Content
You can obviously create a bar chart and a straight or pivot table but direct result like excel is not possible.
- Mark as New
- Bookmark
- Subscribe
- Mute
- Subscribe to RSS Feed
- Permalink
- Report Inappropriate Content
Can this same graph be used in Qlik Sense? If not does anyone have the graph that can be.
Thank you!