Unlock a world of possibilities! Login now and discover the exclusive benefits awaiting you.
- Qlik Community
- :
- All Forums
- :
- QlikView App Dev
- :
- Re: Replacing Null/Missing with Numeric zero for 2...
- Subscribe to RSS Feed
- Mark Topic as New
- Mark Topic as Read
- Float this Topic for Current User
- Bookmark
- Subscribe
- Mute
- Printer Friendly Page
- Mark as New
- Bookmark
- Subscribe
- Mute
- Subscribe to RSS Feed
- Permalink
- Report Inappropriate Content
Replacing Null/Missing with Numeric zero for 2 dimentions
Hello All,
I have a pivot table with one vertical dimension and one horizontal dimension. There is a situation where a specific combination of
dimensional values is not represented in the data but still has a cell in the pivot table. Both
dimensional fields exists in the same data model table. Hence, i am getting type of missing values with just one data model table and two dimensional fields.
look at the example below:-
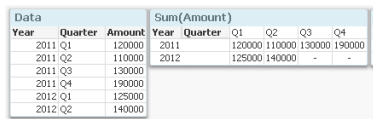
In the example shown in the picture, there are amounts for all quarters in 2011 but not for Q3 and
Q4 2012. When the pivot table is calculated, an algorithm loops over all records in the database.
Since there are no data records for the last two quarters, the consequence is that the expression is
never calculated for these cells (middle and rightmost tables).
Is there a way if i could replace the MISSING(-) values with Numeric 0? May be through set analysis?
Thanks a lot for the help.
Kind Regards,
Varun
- « Previous Replies
-
- 1
- 2
- Next Replies »
- Mark as New
- Bookmark
- Subscribe
- Mute
- Subscribe to RSS Feed
- Permalink
- Report Inappropriate Content
Hello Jeba,
Thanks a lot, this is working file. However i am facing a new problem when i am converting the Pivot into Bar chart. Few Per Int are missing from the graph. Could you possibly have a look at this last piece and help me with the solution? Thank you very much again. you are genius.
Kind Regards,
Varun
- Mark as New
- Bookmark
- Subscribe
- Mute
- Subscribe to RSS Feed
- Permalink
- Report Inappropriate Content
Hi Varun,
Not sure if this is what you were looking for.
Let me know if this doesn't met your requirement
Thanks & Regards
Jeba
- Mark as New
- Bookmark
- Subscribe
- Mute
- Subscribe to RSS Feed
- Permalink
- Report Inappropriate Content
Remove Cohort Group from the Dimesion.
Only use Per Int in the Dimension.
It will give you the desired Result.
See the Attachment.
- Mark as New
- Bookmark
- Subscribe
- Mute
- Subscribe to RSS Feed
- Permalink
- Report Inappropriate Content
Hi Varun
In excel you can do calculations on the numbers represented as text. I am sure qlikview would let you do this as well
Thanks n regards
Padma
- Mark as New
- Bookmark
- Subscribe
- Mute
- Subscribe to RSS Feed
- Permalink
- Report Inappropriate Content
Hi Jeba,
Now the bar graph is showing all the Per Int, but if you compare the 20-25 per int of Bar graph vs above pivot, the above pivot has -18%, but if you look graph for the same Pet Int it is showing nothing. Please let me know if you have any questions.
Kind Regards,
Varun
- Mark as New
- Bookmark
- Subscribe
- Mute
- Subscribe to RSS Feed
- Permalink
- Report Inappropriate Content
I need to use the second dimension because i need to compare the performance of different Cohorts with each other.
- Mark as New
- Bookmark
- Subscribe
- Mute
- Subscribe to RSS Feed
- Permalink
- Report Inappropriate Content
Just by simply removing the Cohort Group from the dimension, it will give you the Correct Answer for every Bucket. eg for 20-25, it is giving -18% at both places.
- « Previous Replies
-
- 1
- 2
- Next Replies »