Unlock a world of possibilities! Login now and discover the exclusive benefits awaiting you.
- Qlik Community
- :
- All Forums
- :
- QlikView App Dev
- :
- Re: Legend Position/Size?
- Subscribe to RSS Feed
- Mark Topic as New
- Mark Topic as Read
- Float this Topic for Current User
- Bookmark
- Subscribe
- Mute
- Printer Friendly Page
- Mark as New
- Bookmark
- Subscribe
- Mute
- Subscribe to RSS Feed
- Permalink
- Report Inappropriate Content
Legend Position/Size?
I can't seem to change the bounding box for my charts' legends. I can drag them around with ctrl+shift, and I get the red/black boxes which should denote size/position, but I can't get my legend to distribute across two or more columns. Any help would be appreciated.
- Mark as New
- Bookmark
- Subscribe
- Mute
- Subscribe to RSS Feed
- Permalink
- Report Inappropriate Content
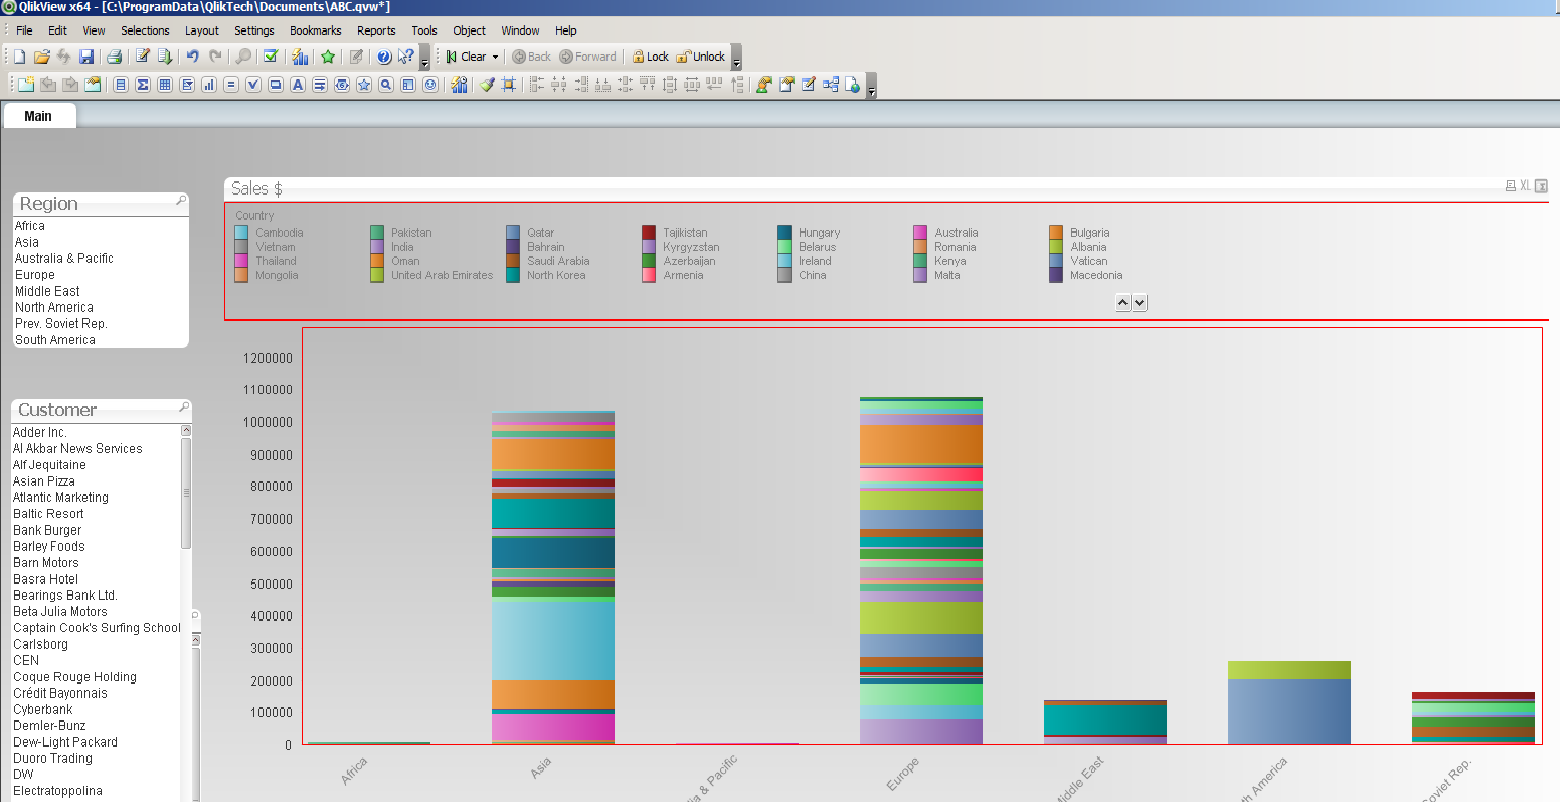
i think its doable and i think you are on the right track. To make this work for me, drag the legend into an area above or below your chart and you will notice that the red boundary bars 'snap into' an area above or below the chart. make sure your legend is sized wide before you try. Then it should start to span left to right. Look at these screenshots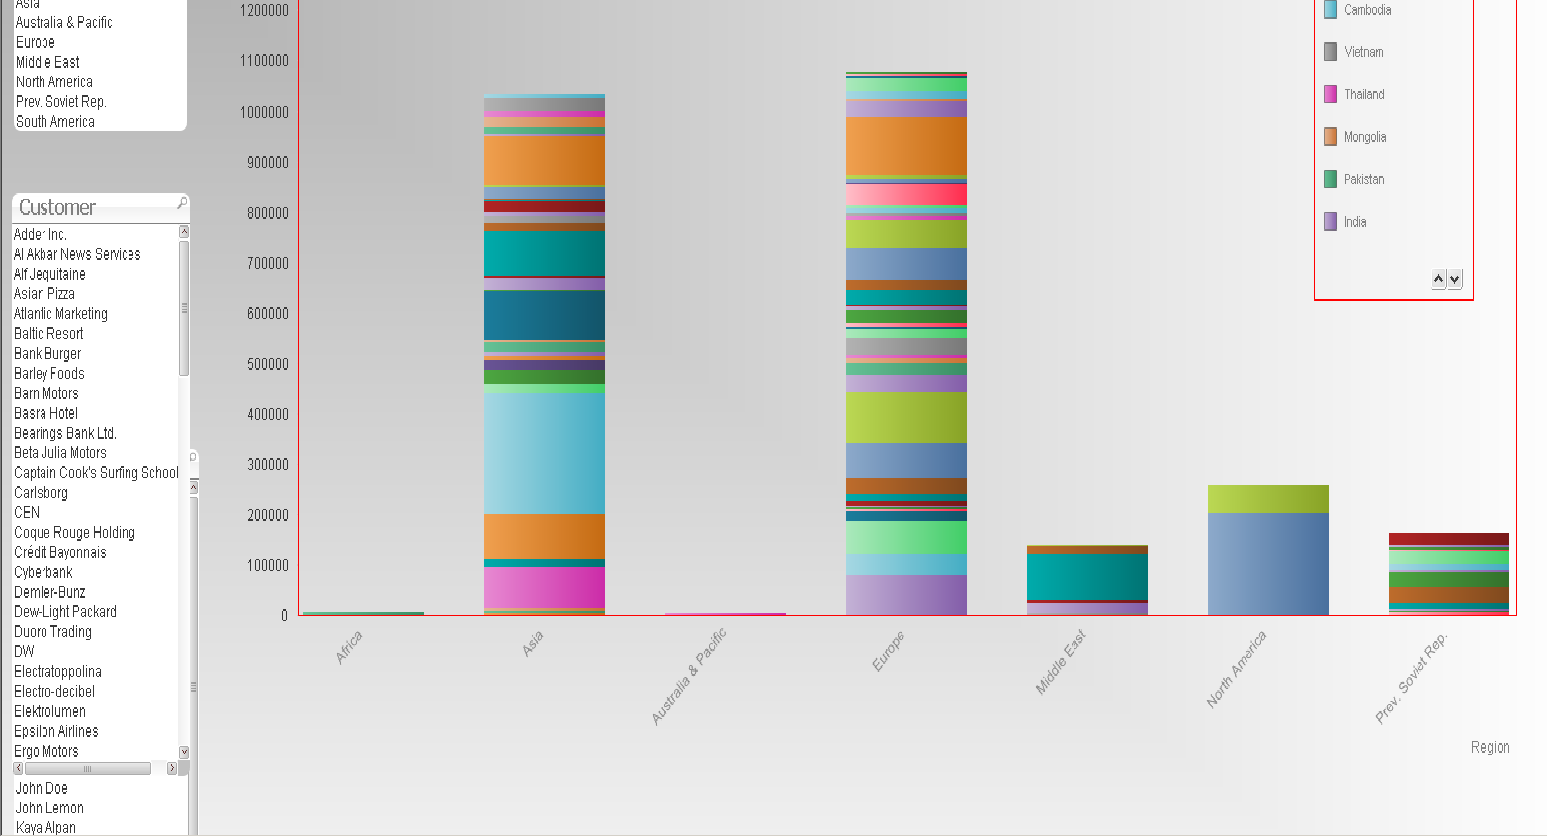
- Mark as New
- Bookmark
- Subscribe
- Mute
- Subscribe to RSS Feed
- Permalink
- Report Inappropriate Content
Hi Jonathan -
I have played with that for a while. I can dock it to any side of the graph and give the legend way, way more room than it needs to generate more than one column, but still no luck. Seems like this is comically difficult for such a simple design request  .
.
- Mark as New
- Bookmark
- Subscribe
- Mute
- Subscribe to RSS Feed
- Permalink
- Report Inappropriate Content
Outside of docking it, did you try expanding the width and decreasing the height forcing multiple columns?
- Mark as New
- Bookmark
- Subscribe
- Mute
- Subscribe to RSS Feed
- Permalink
- Report Inappropriate Content
Yes I did - it just generated scrolling arrows for me.
- Mark as New
- Bookmark
- Subscribe
- Mute
- Subscribe to RSS Feed
- Permalink
- Report Inappropriate Content
Hmm... sounds like you've tried a lot of things trying to get it working. Are you able to share the live QVW sample ?
- Mark as New
- Bookmark
- Subscribe
- Mute
- Subscribe to RSS Feed
- Permalink
- Report Inappropriate Content
Unfortunately no - I ended up scrapping the entire thing in favor of a different solution.