Unlock a world of possibilities! Login now and discover the exclusive benefits awaiting you.
- Qlik Community
- :
- All Forums
- :
- QlikView App Dev
- :
- Re: How to create a candlestick chart???
- Subscribe to RSS Feed
- Mark Topic as New
- Mark Topic as Read
- Float this Topic for Current User
- Bookmark
- Subscribe
- Mute
- Printer Friendly Page
- Mark as New
- Bookmark
- Subscribe
- Mute
- Subscribe to RSS Feed
- Permalink
- Report Inappropriate Content
How to create a candlestick chart???
I am a starter to use qlikview, plz give a suggestion to me in order to make a candlestick chart.
I have such excel file
| TIME | LAST |
| 09:14:29.528551 | 22951 |
| 09:15:29.614293 | 22961 |
| 09:15:29.639119 | 22968 |
| 09:15:29.641101 | 22951 |
| 09:15:29.878346 | 22975 |
| 09:15:29.882078 | 22978 |
| 09:15:29.884098 | 22979 |
| 09:15:30.007220 | 22965 |
| 09:15:30.024216 | 22980 |
| 09:15:30.026978 | 22979 |
| 09:15:30.105209 | 22980 |
| 09:15:30.236066 | 22967 |
| 09:15:30.322187 | 22978 |
| 09:15:30.372227 | 22980 |
| 09:15:30.512260 | 22983 |
| 09:15:30.742066 | 22970 |
| 09:15:30.744072 | 22963 |
| 09:15:30.959001 | 22970 |
| 09:15:31.110226 | 22968 |
| 09:15:31.128118 | 22967 |
| 09:15:31.530215 | 22967 |
| 09:15:32.200263 | 22964 |
| 09:15:32.416145 | 22956 |
| 09:15:32.768265 | 22970 |
| 09:15:33.356351 | 22959 |
| 09:15:33.423385 | 22960 |
| 09:15:33.742317 | 22954 |
| 09:15:34.533320 | 22954 |
| 09:15:34.829320 | 22955 |
I wanna return it into like this in period of one min.
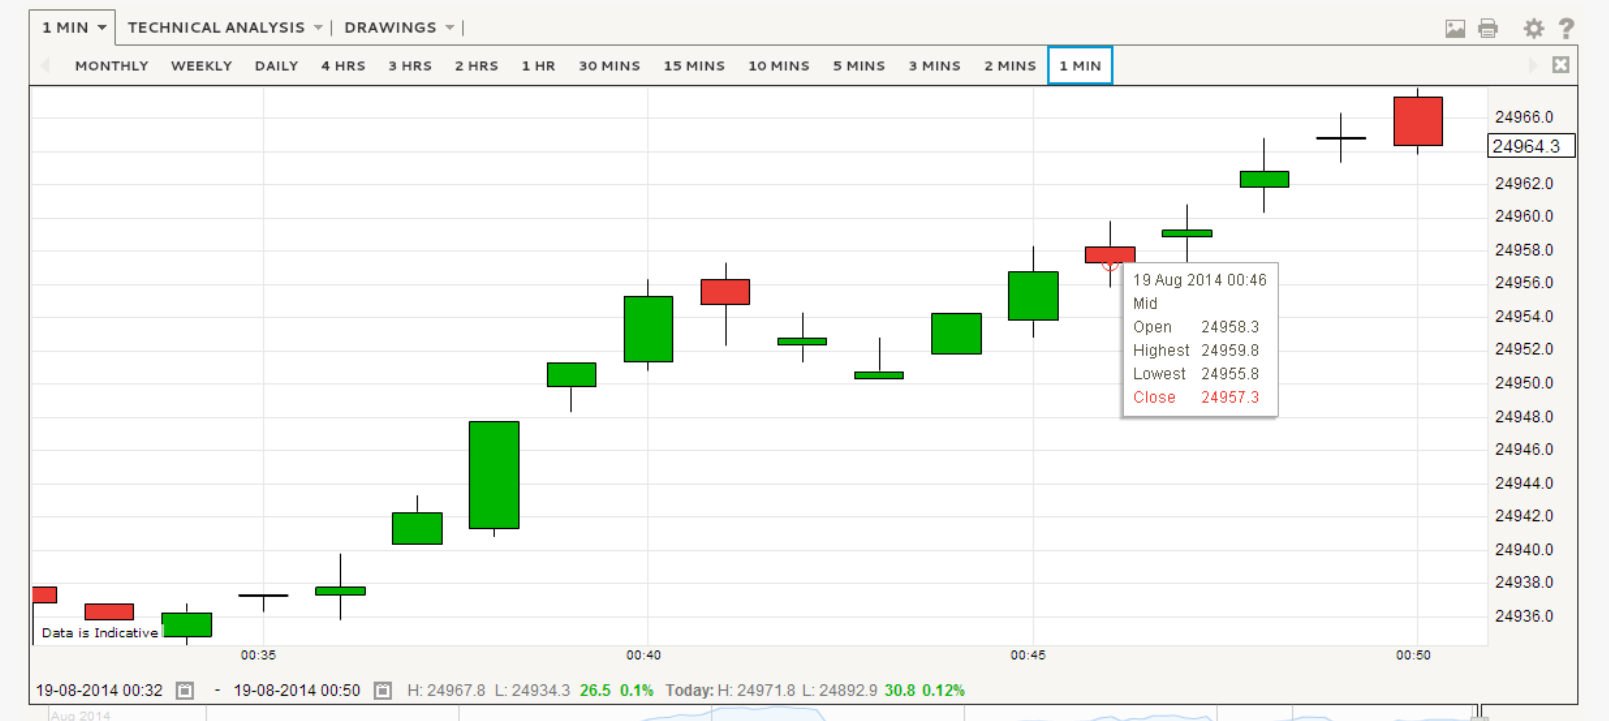
I don't know how to write the expression in order ti generate this chart.
- Mark as New
- Bookmark
- Subscribe
- Mute
- Subscribe to RSS Feed
- Permalink
- Report Inappropriate Content
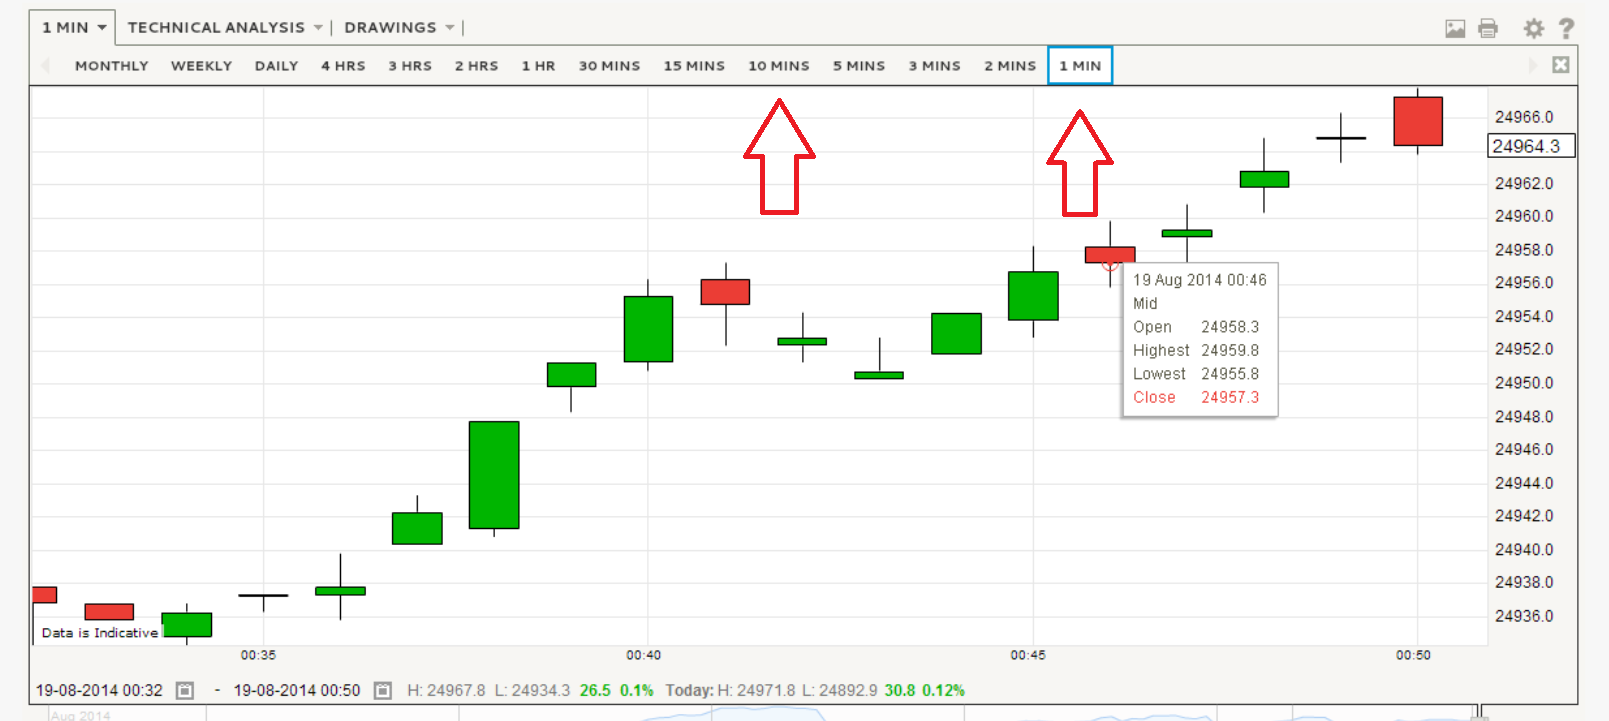
When I press 1min button, it shows every period of one min, then I press 5min button, it shows other graph with period of 5min. I wanna to know how to write,,,thz a lots
- Mark as New
- Bookmark
- Subscribe
- Mute
- Subscribe to RSS Feed
- Permalink
- Report Inappropriate Content
Maybe I presented not very clear I know how to create a candlestick chart with excel provided with stock high, stock low, stock middle, Box Plot Upper Whisker and Box Plot lower Whisker.
But I get the excel in this format below, plz help me to solve, better to provide how to write the expression, such as if(Avg ([Adj. Close]) > Avg ([Adj. Open]), Avg ([Adj. Close]), Avg ([Adj. Open])) (sth like this)
| TIME | LAST |
| 09:14:29.528551 | 22951 |
| 09:15:29.614293 | 22961 |
| 09:15:29.639119 | 22968 |
| 09:15:29.641101 | 22951 |
| 09:15:29.878346 | 22975 |
| 09:15:29.882078 | 22978 |
| 09:15:29.884098 | 22979 |
| 09:15:30.007220 | 22965 |
| 09:15:30.024216 | 22980 |
| 09:15:30.026978 | 22979 |
| 09:15:30.105209 | 22980 |
| 09:15:30.236066 | 22967 |
| 09:15:30.322187 | 22978 |
| 09:15:30.372227 | 22980 |
| 09:15:30.512260 | 22983 |
| 09:15:30.742066 | 22970 |
| 09:15:30.744072 | 22963 |
| 09:15:30.959001 | 22970 |
| 09:15:31.110226 | 22968 |
| 09:15:31.128118 | 22967 |
| 09:15:31.530215 | 22967 |
| 09:15:32.200263 | 22964 |
| 09:15:32.416145 | 22956 |
| 09:15:32.768265 | 22970 |
| 09:15:33.356351 | 22959 |
| 09:15:33.423385 | 22960 |
| 09:15:33.742317 | 22954 |
| 09:15:34.533320 | 22954 |
| 09:15:34.829320 | 22955 |
e.g.
1.start from 09:15:29.614293(2nd data) to 09:15:34.829320(last one)
2. group those date to make one candlestick of the chart, present in 1 min
3. compare the LAST of those data in order to make stock high, stock low, stock middle, Box Plot Upper Whisker and Box Plot lower Whisker
- Mark as New
- Bookmark
- Subscribe
- Mute
- Subscribe to RSS Feed
- Permalink
- Report Inappropriate Content
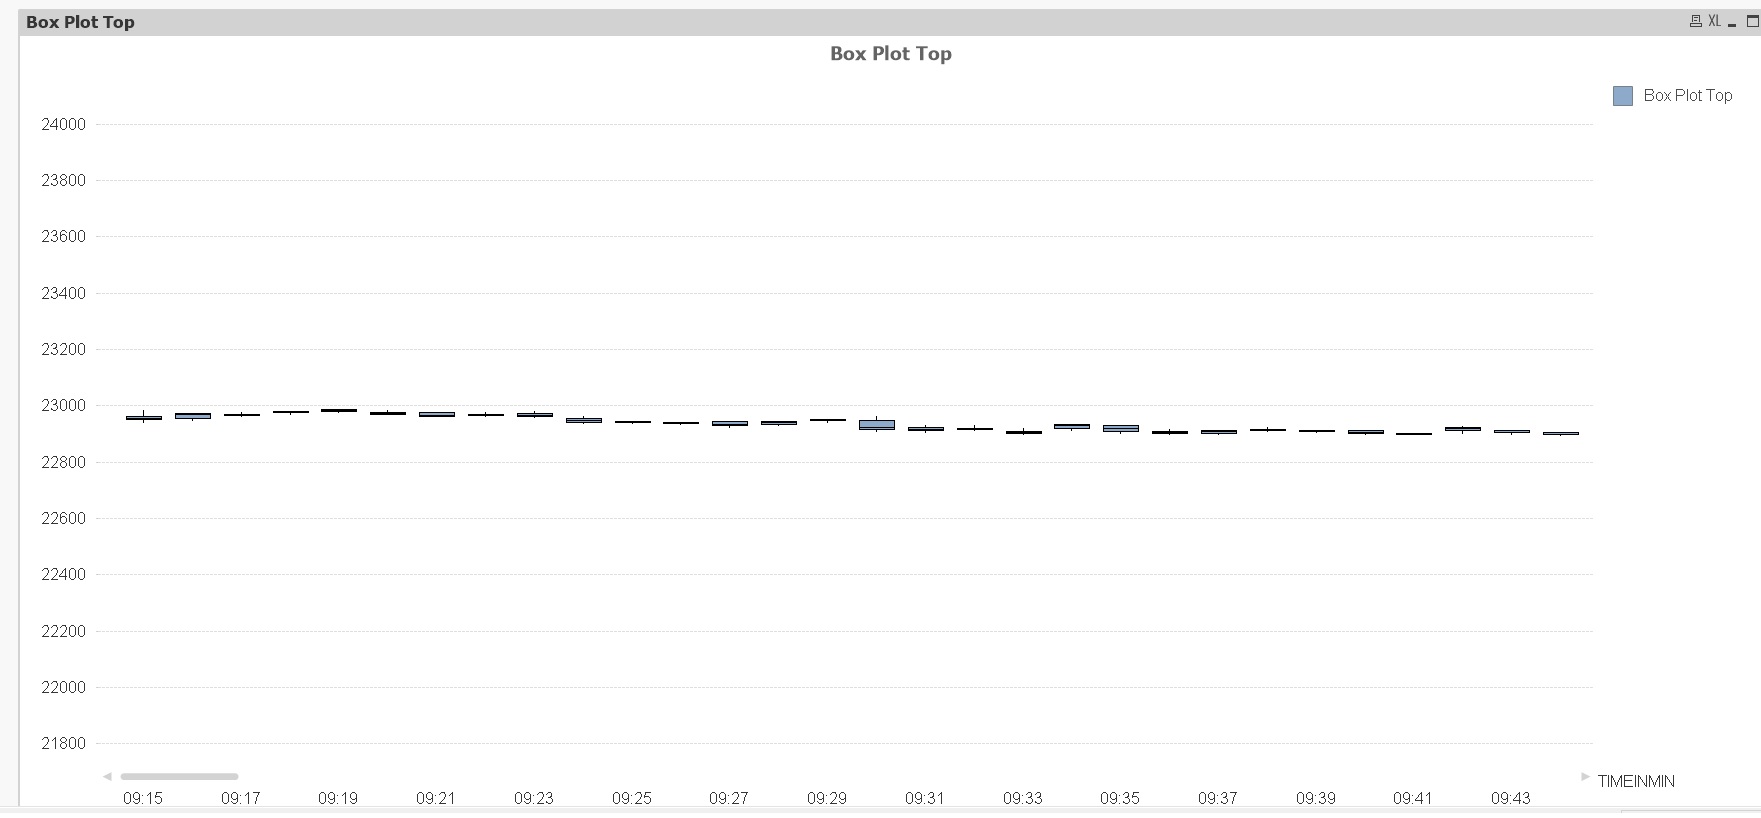
I have attached the steps with screenshot to implement box plot. Try referring.
- Mark as New
- Bookmark
- Subscribe
- Mute
- Subscribe to RSS Feed
- Permalink
- Report Inappropriate Content
But how to make 09:15:29.614293 into 09:15 for comparison. How to type the expression??THZ
- Mark as New
- Bookmark
- Subscribe
- Mute
- Subscribe to RSS Feed
- Permalink
- Report Inappropriate Content
hi,
You can use formatting as below.Time is your time field name.
=Time((Timestamp#(Time,'MM/DD/YYYY hh:mm:ss')),'hh:mm')
Thanx
- Mark as New
- Bookmark
- Subscribe
- Mute
- Subscribe to RSS Feed
- Permalink
- Report Inappropriate Content
How to decrease interval of Y-axis in order to look better
- Mark as New
- Bookmark
- Subscribe
- Mute
- Subscribe to RSS Feed
- Permalink
- Report Inappropriate Content
can you upload your qlikview file?
- Mark as New
- Bookmark
- Subscribe
- Mute
- Subscribe to RSS Feed
- Permalink
- Report Inappropriate Content
Sorry for late reply
- Mark as New
- Bookmark
- Subscribe
- Mute
- Subscribe to RSS Feed
- Permalink
- Report Inappropriate Content
Hi
Just replace your fixed Min and Max with calculated values:
Min(LAST), and Max(LAST)
See attached.
HTH
Jonathan
- Mark as New
- Bookmark
- Subscribe
- Mute
- Subscribe to RSS Feed
- Permalink
- Report Inappropriate Content
How can I colour the candlestick, when last-value of LAST greater than open-value of LAST in Green and last-value of LAST smaller than open-value of LAST in Red.