Unlock a world of possibilities! Login now and discover the exclusive benefits awaiting you.
- Qlik Community
- :
- All Forums
- :
- QlikView App Dev
- :
- Re: BAR chart
- Subscribe to RSS Feed
- Mark Topic as New
- Mark Topic as Read
- Float this Topic for Current User
- Bookmark
- Subscribe
- Mute
- Printer Friendly Page
- Mark as New
- Bookmark
- Subscribe
- Mute
- Subscribe to RSS Feed
- Permalink
- Report Inappropriate Content
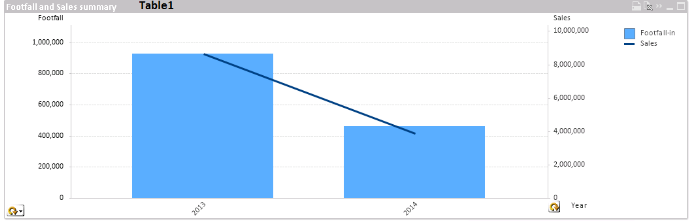
BAR chart
Hi,
I want output like the image?
Regards:
Koti
- Mark as New
- Bookmark
- Subscribe
- Mute
- Subscribe to RSS Feed
- Permalink
- Report Inappropriate Content
Here is a sample. The script and UI has been updated. makedate() was key to making sure your dates were recognized as dates.
- Mark as New
- Bookmark
- Subscribe
- Mute
- Subscribe to RSS Feed
- Permalink
- Report Inappropriate Content
Hi,
Thanks for quick reply.
in the design part in y axis----football
Xaxis Year
and right side axis sales
kindly see the image observe the axis
Regards:
koti
- Mark as New
- Bookmark
- Subscribe
- Mute
- Subscribe to RSS Feed
- Permalink
- Report Inappropriate Content
no problem. Right click on the chart you want to change and go to properties -> axes tab -> Highlight the expression you want to change -> under 'position' change from left -> right or right -> left.
- Mark as New
- Bookmark
- Subscribe
- Mute
- Subscribe to RSS Feed
- Permalink
- Report Inappropriate Content
Hi Jonathan,
I did the same but i didn't get the expected output.
Kindly shared a revised QVW.
Regards:
Koti
- Mark as New
- Bookmark
- Subscribe
- Mute
- Subscribe to RSS Feed
- Permalink
- Report Inappropriate Content
here it is. you can see the changes on the axes tab.
i also added sales and footfall as text on top of the axes . this is done on the presentation tab