Unlock a world of possibilities! Login now and discover the exclusive benefits awaiting you.
- Qlik Community
- :
- All Forums
- :
- QlikView App Dev
- :
- Re: Display value on barchart
- Subscribe to RSS Feed
- Mark Topic as New
- Mark Topic as Read
- Float this Topic for Current User
- Bookmark
- Subscribe
- Mute
- Printer Friendly Page
- Mark as New
- Bookmark
- Subscribe
- Mute
- Subscribe to RSS Feed
- Permalink
- Report Inappropriate Content
Display value on barchart
Hi guys,
I have some date which looks like this:
Stuff Target Achieved
A 1 1
A 1 1
A 1 0
A 1 1
B 1 1
B 1 1
B 1 1
B 1 1
B 1 1
I need to create a barchart which would tell me what's the percentage of the stuff achieved, thus, in this example the barchart would be like:
A -> 75%
B -> 100%
The problems now is that I want to display values on the chart, but instead of the percentage I want to display the number of stuff achieved in each A and B, so it would be like 3 for A and 5 for B, but I want to keep the percentage from 0 to 100 on the Y Axis. How would I do that?
Thanks,
Adrian
PS: No scrips because I can't open them 
- Mark as New
- Bookmark
- Subscribe
- Mute
- Subscribe to RSS Feed
- Permalink
- Report Inappropriate Content
Hi,
Using Bar chart you can add a reference line for threshold 100% like below
Chart Properties-> Presentation -> Reference Lines-> Add -> Give Expression = 1
Hope this helps you.
Regards,
Jagan.
- Mark as New
- Bookmark
- Subscribe
- Mute
- Subscribe to RSS Feed
- Permalink
- Report Inappropriate Content
Unfortunately, I can't open it... Could you please tell me what you modified?
Thank you so much for your time, Manish!
- Mark as New
- Bookmark
- Subscribe
- Mute
- Subscribe to RSS Feed
- Permalink
- Report Inappropriate Content
Disable Third Expression or Remove it completely
First Expression , only tick Bar and untick Line
Second expression, only tick Values on data point.. .Bar and line should be unticked...
- Mark as New
- Bookmark
- Subscribe
- Mute
- Subscribe to RSS Feed
- Permalink
- Report Inappropriate Content
Hi,
If I do this, the line would be at the top of the bars. That line should have an expression (the one that was there) and remain "up" regardless the two bars not being at 100%.
- Mark as New
- Bookmark
- Subscribe
- Mute
- Subscribe to RSS Feed
- Permalink
- Report Inappropriate Content
Hi,
I know I can do that, but I need a fixed expression for the line and still have the numbers on the bars
- Mark as New
- Bookmark
- Subscribe
- Mute
- Subscribe to RSS Feed
- Permalink
- Report Inappropriate Content
Dear Adrian,
Try this,
Chart Properties > Tab "Expressions" > Un check to "Relative" > Apply > OK.
Kind regards,
Ishfaque Ahmed
- Mark as New
- Bookmark
- Subscribe
- Mute
- Subscribe to RSS Feed
- Permalink
- Report Inappropriate Content
I want the numbers to be shown on the bar charts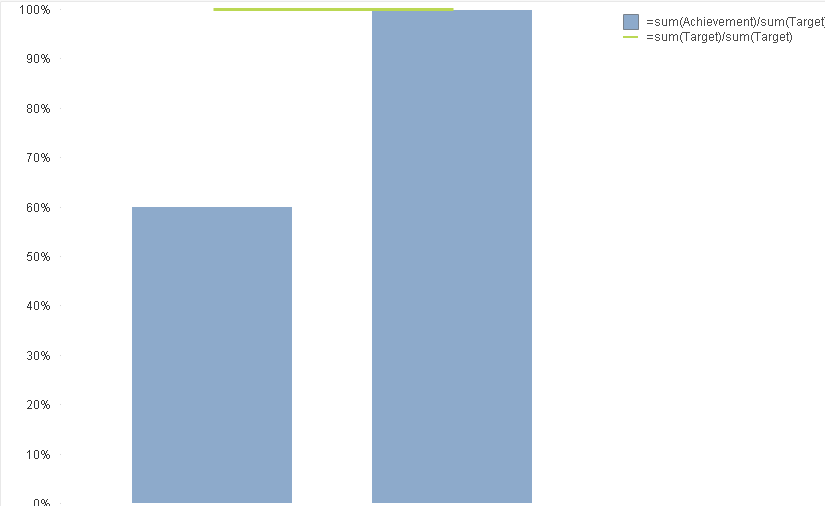
- Mark as New
- Bookmark
- Subscribe
- Mute
- Subscribe to RSS Feed
- Permalink
- Report Inappropriate Content
before inserting the line which is in the other picture (scroll up a bit), my graph is like this (and it's perfectly correct), but when I insert the line at 100% (which has an expression), the 3 and 6 are not displayed anymore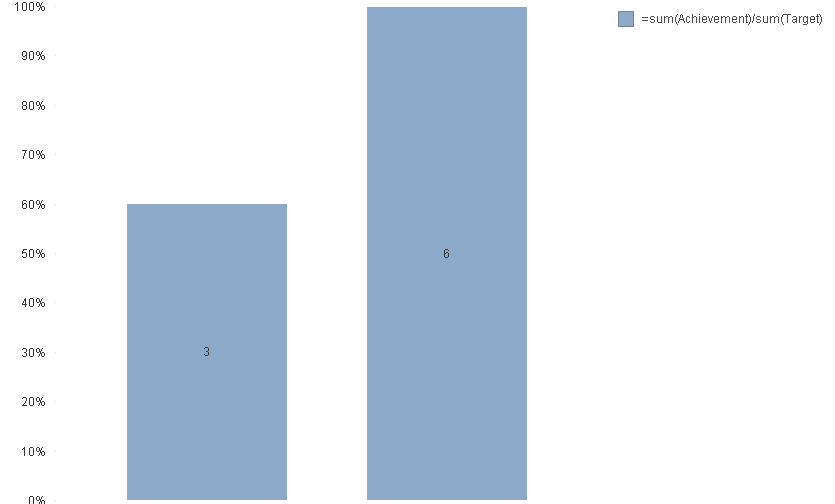
- Mark as New
- Bookmark
- Subscribe
- Mute
- Subscribe to RSS Feed
- Permalink
- Report Inappropriate Content
Hi
why cant you try for fast type change option
try to convert the existing/correct bar chart to the combo chart and check for the solution
may it works fine for you
- Mark as New
- Bookmark
- Subscribe
- Mute
- Subscribe to RSS Feed
- Permalink
- Report Inappropriate Content
The chart works fine even if it's a Combo, the problem comes up when I add a third expression (for the threshold line). At the moment, for example, I have just two expression, the chart is Combo (but I have no line in there) and it works fine. As soon as I add the line, the numbers are not displayed anymore