Unlock a world of possibilities! Login now and discover the exclusive benefits awaiting you.
- Qlik Community
- :
- All Forums
- :
- QlikView App Dev
- :
- Re: Re: Add fixed position comment to chart
- Subscribe to RSS Feed
- Mark Topic as New
- Mark Topic as Read
- Float this Topic for Current User
- Bookmark
- Subscribe
- Mute
- Printer Friendly Page
- Mark as New
- Bookmark
- Subscribe
- Mute
- Subscribe to RSS Feed
- Permalink
- Report Inappropriate Content
Add fixed position comment to chart
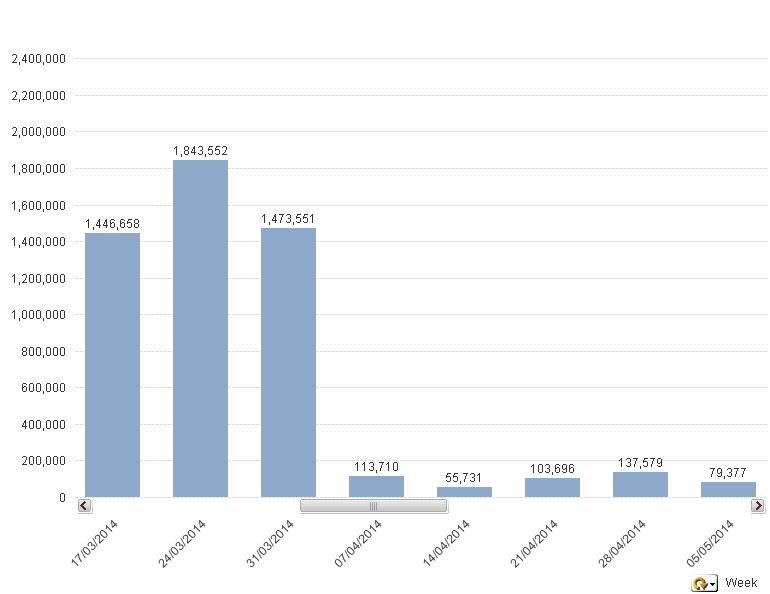
Is it possible to add a comment to a chart in a fixed position relative to the data?
For example in the chart below, i would like to add a comment between weeks 31/3 and 7/4 to explain the large change in numbers. However i would obviously require the comment to move along with the graph when the user scrolls.
Clearly just adding a text object would not work.
Accepted Solutions
- Mark as New
- Bookmark
- Subscribe
- Mute
- Subscribe to RSS Feed
- Permalink
- Report Inappropriate Content
- Mark as New
- Bookmark
- Subscribe
- Mute
- Subscribe to RSS Feed
- Permalink
- Report Inappropriate Content
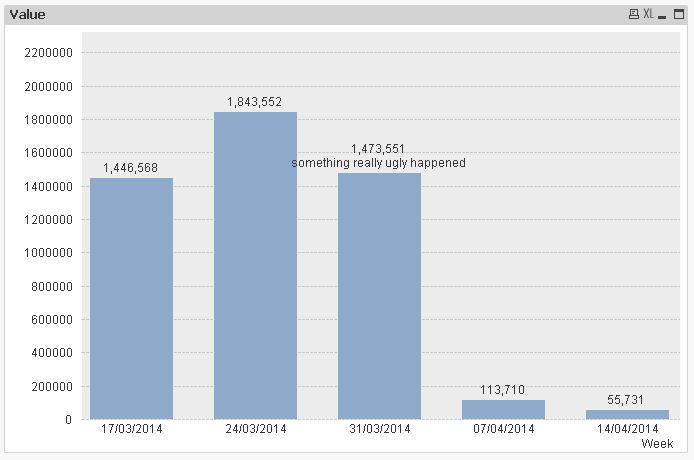
Is this closer to what you want ?
- Mark as New
- Bookmark
- Subscribe
- Mute
- Subscribe to RSS Feed
- Permalink
- Report Inappropriate Content
Hi,
another solution that might also help:
regards
Marco
- Mark as New
- Bookmark
- Subscribe
- Mute
- Subscribe to RSS Feed
- Permalink
- Report Inappropriate Content
Hi,
Try like this
Chart Properties -> Presentation -> Text in Chart -> Add -> Give your text -> OK -> OK
Now click on chart and hold ctrl + shift buttons and move the label to required position in chart. Hope this helps you.
Regards,
Jagan.
- Mark as New
- Bookmark
- Subscribe
- Mute
- Subscribe to RSS Feed
- Permalink
- Report Inappropriate Content
That method doesn't work, because the text does not move with the associated data.
If i use the x-axis scrollbar, the data move by the text stays still. I need the text to move with the data when the user uses the scrollbar
- Mark as New
- Bookmark
- Subscribe
- Mute
- Subscribe to RSS Feed
- Permalink
- Report Inappropriate Content
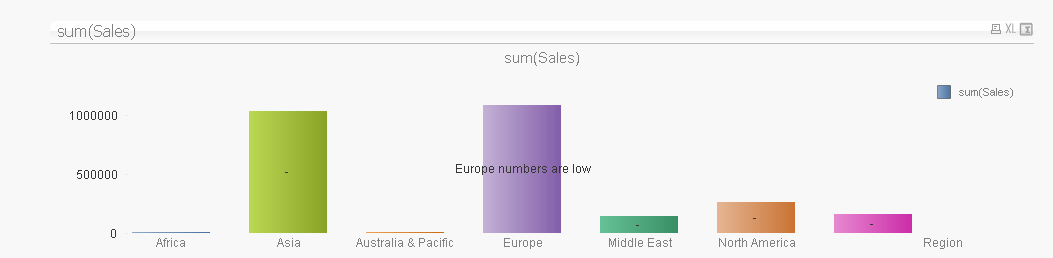
Hi Jonathan,
this almost works. However, it makes the values on each bar data point turn into a dash. The bars themselves don't change, it's just they have a - above them now instead of a number.
I was able to get round this by clicking the 'text on axis' box, which end in the same end result.
Thanks for your help
Alex
- Mark as New
- Bookmark
- Subscribe
- Mute
- Subscribe to RSS Feed
- Permalink
- Report Inappropriate Content
I am connecting directly to a database, so this isn't an option unfortunately.
- Mark as New
- Bookmark
- Subscribe
- Mute
- Subscribe to RSS Feed
- Permalink
- Report Inappropriate Content
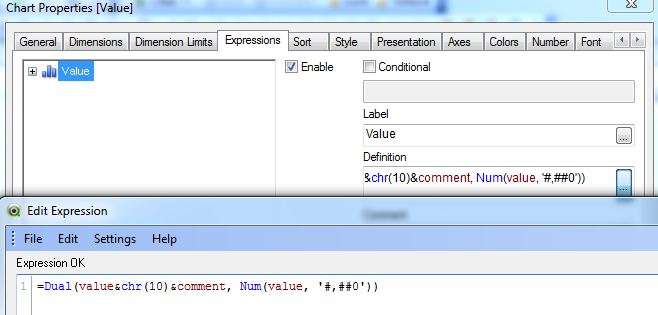
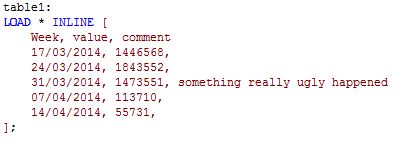
the comment does not need to be loaded from a DB of course:
=If(Week='31/03/2014',Dual(value&chr(10)&'something really ugly happened', Num(value, '#,##0')),Num(value, '#,##0'))
as a front end expression delivers the same result:

hope this helps
regards
Marco