Unlock a world of possibilities! Login now and discover the exclusive benefits awaiting you.
- Qlik Community
- :
- All Forums
- :
- QlikView App Dev
- :
- Re: Reduce column-width for linear guage?
- Subscribe to RSS Feed
- Mark Topic as New
- Mark Topic as Read
- Float this Topic for Current User
- Bookmark
- Subscribe
- Mute
- Printer Friendly Page
- Mark as New
- Bookmark
- Subscribe
- Mute
- Subscribe to RSS Feed
- Permalink
- Report Inappropriate Content
Reduce column-width for linear guage?
Hey, how do I reduce the column width for a linear gauge? I've tried RTrim, LTrim, even changing my load script?
- « Previous Replies
-
- 1
- 2
- Next Replies »
- Mark as New
- Bookmark
- Subscribe
- Mute
- Subscribe to RSS Feed
- Permalink
- Report Inappropriate Content
Hi,
Can you attach sample application
Regards
ASHFAQ
- Mark as New
- Bookmark
- Subscribe
- Mute
- Subscribe to RSS Feed
- Permalink
- Report Inappropriate Content
Ashfaq,
I'm not sure how to do this...our tables have 921K rows...I'll have to create some fake data...and that might take a while...
I'll try
- Mark as New
- Bookmark
- Subscribe
- Mute
- Subscribe to RSS Feed
- Permalink
- Report Inappropriate Content
Can try push Ctrl+Caps and move elements
- Mark as New
- Bookmark
- Subscribe
- Mute
- Subscribe to RSS Feed
- Permalink
- Report Inappropriate Content
are there any negative values in your 921k rows?
(it Looks like that as I had the same behaviour)
try to make two Charts one for positive for for negative values
- Mark as New
- Bookmark
- Subscribe
- Mute
- Subscribe to RSS Feed
- Permalink
- Report Inappropriate Content
Enrique, I tried Ctrl_Caps...it doesn't do anything...
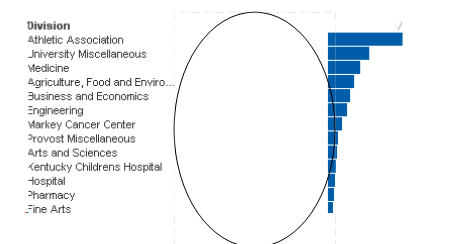
I think it has to do with leaving space, for negative amounts...? from -1 to 0 ? I'm only showing values from 0 to 1:
My Dimension is: Division
My Expressions
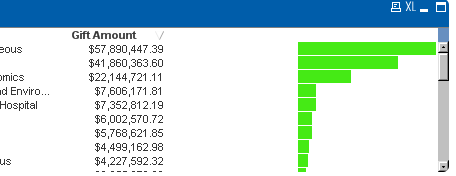
1. Sum ([Gifts Amount])
2. Sum([Gifts Amount]) / Max(Total Aggr(Sum([Gifts Amount]), [Gifts Division]))
- this follows Stephen Redmond's Cookbook... only, his example does have the wide Guage column...
- Mark as New
- Bookmark
- Subscribe
- Mute
- Subscribe to RSS Feed
- Permalink
- Report Inappropriate Content
Hey, I did some research and did find some negative amounts... so hm, not sure how to deal with this
- Mark as New
- Bookmark
- Subscribe
- Mute
- Subscribe to RSS Feed
- Permalink
- Report Inappropriate Content
Yes probably if you have negative elements the space is reserved for
- Mark as New
- Bookmark
- Subscribe
- Mute
- Subscribe to RSS Feed
- Permalink
- Report Inappropriate Content
For Caps+Ctrl you need table active
- Mark as New
- Bookmark
- Subscribe
- Mute
- Subscribe to RSS Feed
- Permalink
- Report Inappropriate Content
Tried to add set analysis to eliminate values less than zero:
From
Sum([Gifts Amount]) / Max(Total Aggr(Sum([Gifts Amount]), [Gifts Division]))
To:
Sum({$< [Gifts Amount] = {">=0"} >}[Gifts Amount] ) / Max(Total Aggr(Sum({$< [Gifts Amount] = {">=0"} >}[Gifts Amount] ), [Gifts Division]))
But my chart was unaffected .. will keep trying
- « Previous Replies
-
- 1
- 2
- Next Replies »