Unlock a world of possibilities! Login now and discover the exclusive benefits awaiting you.
- Qlik Community
- :
- All Forums
- :
- QlikView App Dev
- :
- Re: Including all items in list as expression to c...
- Subscribe to RSS Feed
- Mark Topic as New
- Mark Topic as Read
- Float this Topic for Current User
- Bookmark
- Subscribe
- Mute
- Printer Friendly Page
- Mark as New
- Bookmark
- Subscribe
- Mute
- Subscribe to RSS Feed
- Permalink
- Report Inappropriate Content
Including all items in list as expression to chart(Pivot Table)
Hi,
I am trying to create a customized table with user selected fields and expression. But stuck... Is there any way to display all selected items as expression... I do not want to list them individually in expression.. What I am trying to do is I will update the list of expression in excel and once I reload the app it should update the chart with added expression in list.
Any help would be appreciated..
Thanks,
- Tags:
- new_to_qlikview
- Mark as New
- Bookmark
- Subscribe
- Mute
- Subscribe to RSS Feed
- Permalink
- Report Inappropriate Content
Hi Kamal
how many tables are you looking to put in you app as a starting point
- Mark as New
- Bookmark
- Subscribe
- Mute
- Subscribe to RSS Feed
- Permalink
- Report Inappropriate Content
only one table with multiple fields..
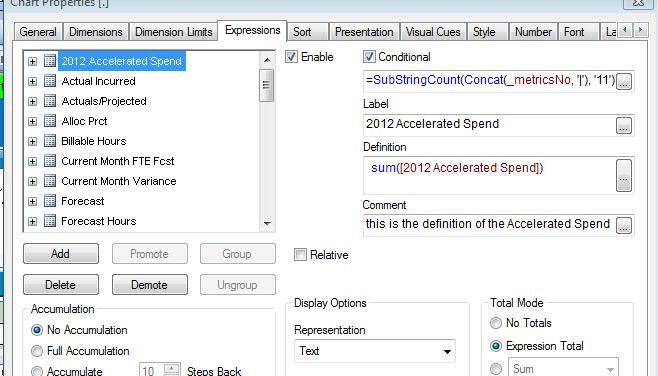
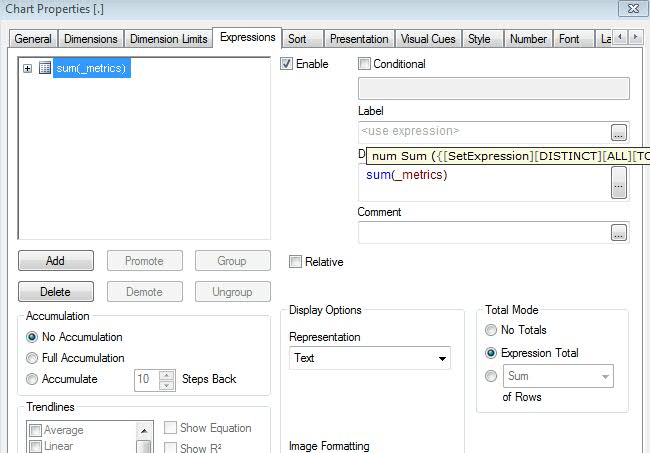
I have already tried this and now I am looking for some better way.. I have more than 100 fields for expression and it is very difficult to list all of them and then write function for them.. Also it there is any new field is added.. I have to again include that in the list...
what I am looking for is.. something like this.. _metrics is the header of list
I have done this...
I want to do this...
- Mark as New
- Bookmark
- Subscribe
- Mute
- Subscribe to RSS Feed
- Permalink
- Report Inappropriate Content
Maybe something like this?
Dynamic Tables - An alternative approach to CONCAT using BIT operators

