Unlock a world of possibilities! Login now and discover the exclusive benefits awaiting you.
- Qlik Community
- :
- All Forums
- :
- QlikView App Dev
- :
- Re: Re: Pivot-table layout and data-model problem
- Subscribe to RSS Feed
- Mark Topic as New
- Mark Topic as Read
- Float this Topic for Current User
- Bookmark
- Subscribe
- Mute
- Printer Friendly Page
- Mark as New
- Bookmark
- Subscribe
- Mute
- Subscribe to RSS Feed
- Permalink
- Report Inappropriate Content
Pivot-table layout and data-model problem
Hi folks,
I want to create something looking like this in Qlikview 11
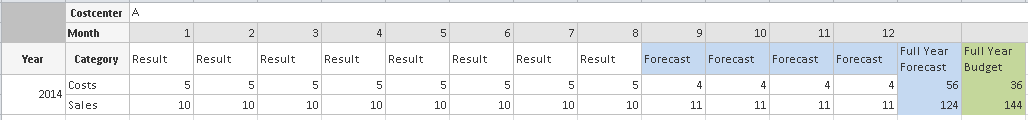
The rule is that if there is a forecast-value that one shall be presented otherwise the result.
I have come somewhat near the layout above by taking sum(Result+Forecast) and also the budget for every month and then letting the built-in Total replace the 'Full Year'-columns.
Findings:
-The problem with sum(Result+Forecast) comes when there is both a result and a forecast for a month then we get into problem with almost double the true values.
-The problem with if(sum(Forecast)>0,sum(Forecast),sum(Result)) comes when looking at the total which will only contain the forecasts...
- A column cannot be hidden in a Pivot-table.
- Set-analysis cannot be used since it depends on a dimension and is only evaluated once per object.
I've created a small qvw example which is attached.
Any hints are highly appreciated
brgds
Andy
Accepted Solutions
- Mark as New
- Bookmark
- Subscribe
- Mute
- Subscribe to RSS Feed
- Permalink
- Report Inappropriate Content
Hi
How about:
Sum(Aggr(If(Sum(ForecastResult)<>0, Sum(ForecastResult), Sum(Result)), Year, Category, Costcenter, Month))
HTH
Jonathan
- Mark as New
- Bookmark
- Subscribe
- Mute
- Subscribe to RSS Feed
- Permalink
- Report Inappropriate Content
Hi Andreas,
Can not open your personal edition document.
How about using this expression
=SUM( If (Forecast >0, Forecast, Result))
The above expression evaluates the condition for each record and then sum up the output.
Regards,
Kalpesh
- Mark as New
- Bookmark
- Subscribe
- Mute
- Subscribe to RSS Feed
- Permalink
- Report Inappropriate Content
Hi,
Strange with the file, if my Qlikview lost the license and started in Personal Edition that should not stop you from opening the document. If you have a license you can open any file. Anyway I have re-attached the qvw now stored within a licensed Qlikview,
Regarding you hint, since the data for result, budget and forecast are concatenated the values do not stay on the same rows so that if-condition will result in the same result as sum(Result) + sum(ForecastResult)
Thanks anyway!
/Andreas
- Mark as New
- Bookmark
- Subscribe
- Mute
- Subscribe to RSS Feed
- Permalink
- Report Inappropriate Content
Hi
How about:
Sum(Aggr(If(Sum(ForecastResult)<>0, Sum(ForecastResult), Sum(Result)), Year, Category, Costcenter, Month))
HTH
Jonathan
- Mark as New
- Bookmark
- Subscribe
- Mute
- Subscribe to RSS Feed
- Permalink
- Report Inappropriate Content
Hello,
In expression if(sum(ForecastResult)>0, sum(ForecastResult),sum(Result)), the values returned are not as the same as sum(Result) + sum(ForecastResult), becuase the dimensions it is based on. That yields the same result as you showed as desired result in your attached qvw file. (I made a small change in the attachment to show the diff between expressions).
In case you do not want the result as if(sum(ForecastResult)>0, sum(ForecastResult),sum(Result)), could you please specify what are the dimension conditions?
PFA.
Thanks!
- Mark as New
- Bookmark
- Subscribe
- Mute
- Subscribe to RSS Feed
- Permalink
- Report Inappropriate Content
Hi,
As mentioned in the first post
-"-The problem with if(sum(Forecast)>0,sum(Forecast),sum(Result)) comes when looking at the total which will only contain the forecasts..."
The total column only sum the Forecast-values, the other columns are as wanted.
/Andreas
- Mark as New
- Bookmark
- Subscribe
- Mute
- Subscribe to RSS Feed
- Permalink
- Report Inappropriate Content
Hi,
This solves the problem in the example-file, thanks!
(Tried it before but forgot a dimension in it)
In the real application there there are more categories than sales and cost and some of them are not included in the forecast, then this solution will get the result for these which is wrong.
If I modify the example and remove the forecast for Category=Sales then in September (there is a forecast as well as a result) the figures for Cost will come from the forecast (Correct) but for the Sales it will be the Result-figures which is incorrect since I would like that to be 0 or null();
Maybe the best solution is to add a forecast of 0 and in the IF-condition look for a _ForecastFlag instead?
/Andreas
- Mark as New
- Bookmark
- Subscribe
- Mute
- Subscribe to RSS Feed
- Permalink
- Report Inappropriate Content
Hi again,
I added a new table in the script holding a flag F or P for every month and forecast-label and then look at that flag in the The sum(Aggr expression posted by Jonathan. This should work for all the scenarios I can think of at the moment.
I attach the solution
Thanks for the help!
/Andreas