Unlock a world of possibilities! Login now and discover the exclusive benefits awaiting you.
- Qlik Community
- :
- All Forums
- :
- QlikView App Dev
- :
- Re: ONE linear trendline, for bar chart
- Subscribe to RSS Feed
- Mark Topic as New
- Mark Topic as Read
- Float this Topic for Current User
- Bookmark
- Subscribe
- Mute
- Printer Friendly Page
- Mark as New
- Bookmark
- Subscribe
- Mute
- Subscribe to RSS Feed
- Permalink
- Report Inappropriate Content
ONE linear trendline, for bar chart
Is it possible to have one linear trendline, for a bar chart with 3 dimensions?
If I tick the 'Linear' box i get a trendline for each value, which I do not want. I only want one one trendline for the total
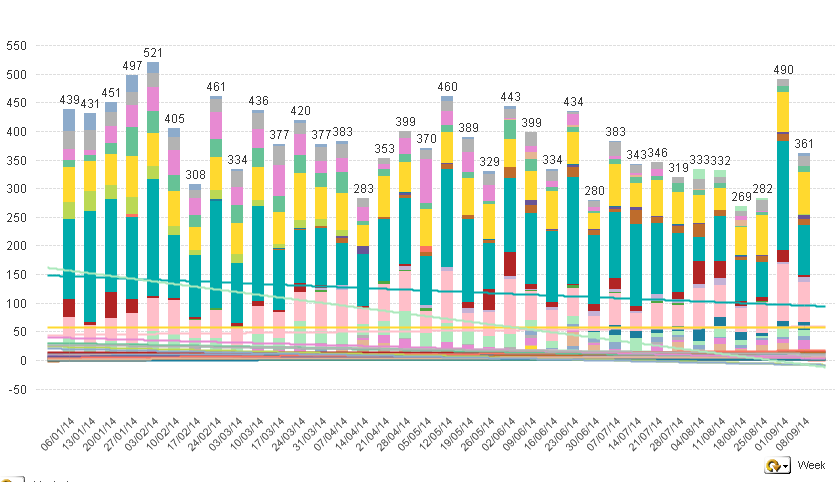
The only way I can see to do this is to remove the 3rd dimension, but i do not want to do this!
How can i retain the stacked bar chart and also only have one trendline for the total?
My expression is very simple:
=SUM(Revenue/1000)
Accepted Solutions
- Mark as New
- Bookmark
- Subscribe
- Mute
- Subscribe to RSS Feed
- Permalink
- Report Inappropriate Content
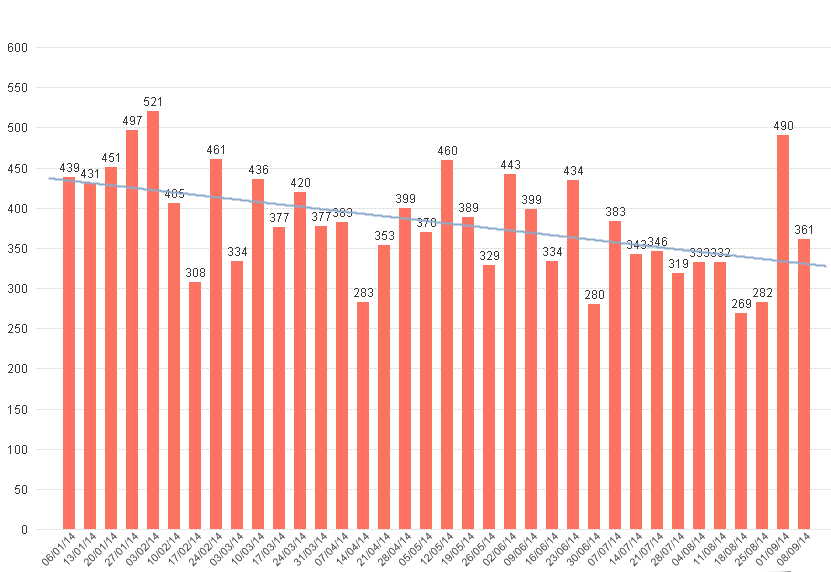
You can try to create an expression, unchecking 'Bar' and checking 'Values on data', in this expression is where you have to check the linear trendline.
The expression should be something like:
Sum(TOTAL <Week> Revenue/1000)
- Mark as New
- Bookmark
- Subscribe
- Mute
- Subscribe to RSS Feed
- Permalink
- Report Inappropriate Content
I get the error message 'Drawing of chart failed internally' when I tried to do this
- Mark as New
- Bookmark
- Subscribe
- Mute
- Subscribe to RSS Feed
- Permalink
- Report Inappropriate Content
Is it possible to use a Reference Line? I can't figure out what the formula would be though
- Mark as New
- Bookmark
- Subscribe
- Mute
- Subscribe to RSS Feed
- Permalink
- Report Inappropriate Content
I have done this with 2 dimensions, I added one more dimension to my graph and still draws it.
Can you upload a sample?
- Mark as New
- Bookmark
- Subscribe
- Mute
- Subscribe to RSS Feed
- Permalink
- Report Inappropriate Content
i used the wrong 'week' field
it worked! thanks so much