Unlock a world of possibilities! Login now and discover the exclusive benefits awaiting you.
- Qlik Community
- :
- All Forums
- :
- QlikView App Dev
- :
- Re: why does charts show zero values seperated?
- Subscribe to RSS Feed
- Mark Topic as New
- Mark Topic as Read
- Float this Topic for Current User
- Bookmark
- Subscribe
- Mute
- Printer Friendly Page
- Mark as New
- Bookmark
- Subscribe
- Mute
- Subscribe to RSS Feed
- Permalink
- Report Inappropriate Content
why does charts show zero values seperated?

hi guys, I hope you can help me 
I have 3DIM: 1. Country, 2.FMonth, 3.FYear.
I want to show all Values from FMonth (checked, and also supress zero)
Now it shows the values in separated Years with selected and with "-" where the NULL values are..
Is it possible to combine the NULL/Zero-Values in 1 Year ?
I have also tested with "show all values " for Fyear(3. DIM), but it only shows every year that I've got in my Database..
Best regards,
Tob
- « Previous Replies
-
- 1
- 2
- Next Replies »
- Mark as New
- Bookmark
- Subscribe
- Mute
- Subscribe to RSS Feed
- Permalink
- Report Inappropriate Content
No no,
I want like this
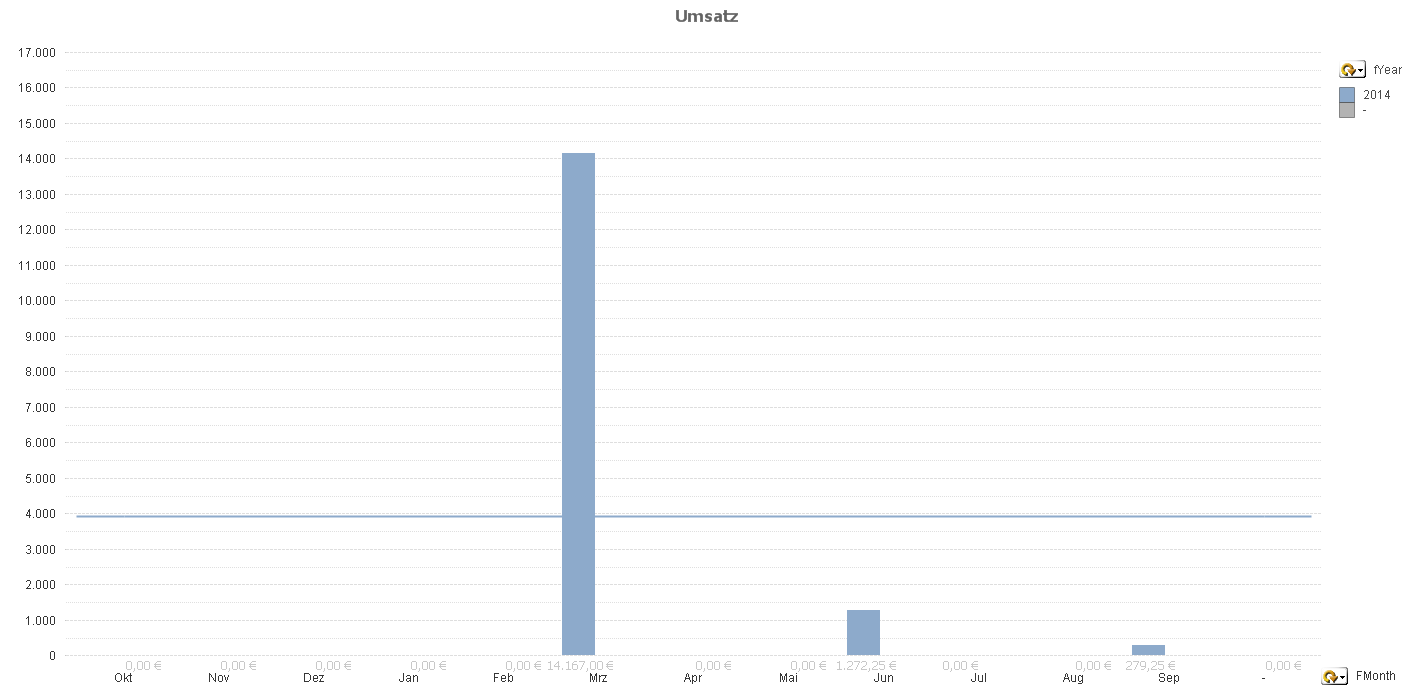
But, the zeros should be in 2014.. not separeted..
- Mark as New
- Bookmark
- Subscribe
- Mute
- Subscribe to RSS Feed
- Permalink
- Report Inappropriate Content
It doenst work..
i also tried
if(Month(IsNull(sum(EURamount))),0.1,sum(EURamount))
- Mark as New
- Bookmark
- Subscribe
- Mute
- Subscribe to RSS Feed
- Permalink
- Report Inappropriate Content
ok.. then you have to work on data modelling itself.
you have to create "0" in month field and it has to be mapped with norelated datas.
If you are not understanding please attach the application here
-Sathish
- Mark as New
- Bookmark
- Subscribe
- Mute
- Subscribe to RSS Feed
- Permalink
- Report Inappropriate Content
right, but how can I express this in my script?
I have also other Types like Region, Customer, Salesperson ...
How can I tell Qlikview to show 0 for every Dimension if its not a value ?
- Mark as New
- Bookmark
- Subscribe
- Mute
- Subscribe to RSS Feed
- Permalink
- Report Inappropriate Content
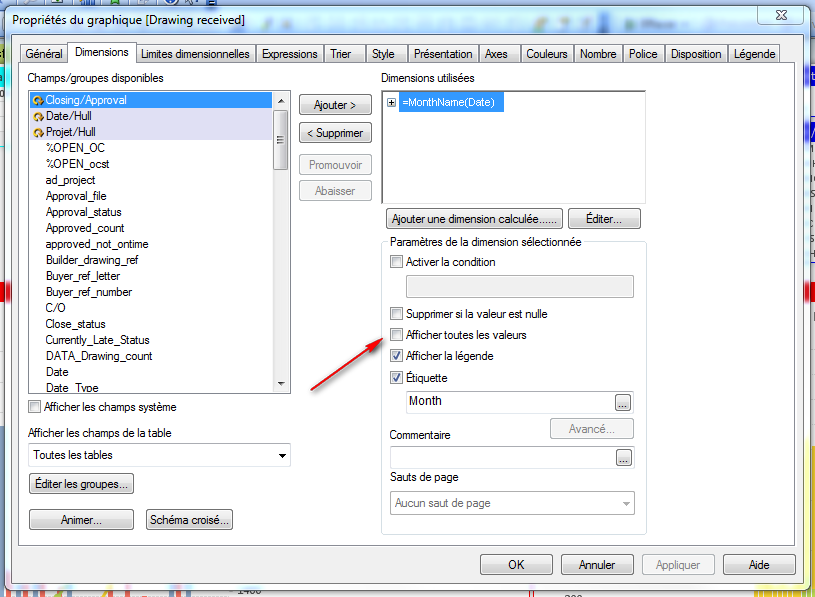
Did you tried :
In your graphic Propriety box, sheet Dimension, stick ‘Shows Al value”
- Mark as New
- Bookmark
- Subscribe
- Mute
- Subscribe to RSS Feed
- Permalink
- Report Inappropriate Content
yes, but it shows chart in separated years: "2014" and "-"
- Mark as New
- Bookmark
- Subscribe
- Mute
- Subscribe to RSS Feed
- Permalink
- Report Inappropriate Content
is it possible to post your .qvw ?
- Mark as New
- Bookmark
- Subscribe
- Mute
- Subscribe to RSS Feed
- Permalink
- Report Inappropriate Content
Its very easy only.. attach your application or attach your data modelling.
-Sathish
- « Previous Replies
-
- 1
- 2
- Next Replies »