Unlock a world of possibilities! Login now and discover the exclusive benefits awaiting you.
- Qlik Community
- :
- All Forums
- :
- QlikView App Dev
- :
- Re: Automated count
- Subscribe to RSS Feed
- Mark Topic as New
- Mark Topic as Read
- Float this Topic for Current User
- Bookmark
- Subscribe
- Mute
- Printer Friendly Page
- Mark as New
- Bookmark
- Subscribe
- Mute
- Subscribe to RSS Feed
- Permalink
- Report Inappropriate Content
Automated count
Hello Qlik Folks,
How can I auto count Id's for only last year, last quarter and last half year in straight or pivot tables using if condition or set analysis
- Tags:
- qlikview_scripting
- « Previous Replies
-
- 1
- 2
- Next Replies »
- Mark as New
- Bookmark
- Subscribe
- Mute
- Subscribe to RSS Feed
- Permalink
- Report Inappropriate Content
Last Year: Count({<Year={$(=Max(Year))}>} ID)
Last Quarter: Count({<Quarter={$(=Max(Quarter))}>} ID)
- Mark as New
- Bookmark
- Subscribe
- Mute
- Subscribe to RSS Feed
- Permalink
- Report Inappropriate Content
Last Year: Count({<Year={$(=Year(Today())-1)}>} Id)
- Mark as New
- Bookmark
- Subscribe
- Mute
- Subscribe to RSS Feed
- Permalink
- Report Inappropriate Content
please post sample data and expected result
thanks
regards
Marco
- Mark as New
- Bookmark
- Subscribe
- Mute
- Subscribe to RSS Feed
- Permalink
- Report Inappropriate Content
Hi Dinesh.
Please post your application here.
-Sathish
- Mark as New
- Bookmark
- Subscribe
- Mute
- Subscribe to RSS Feed
- Permalink
- Report Inappropriate Content
Hear is the sample QVW
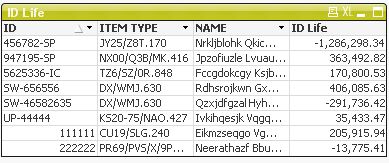
you can see duplicate ID with different counts but what I want to see is single ID with sum of id life, 180 days and last trend, i don't want duplicate ID's
I am ready to remove SC Reading Date and Reading if they are the reason for duplicates but it collapse whole table
is there a possibility where I can remove them ?
- Mark as New
- Bookmark
- Subscribe
- Mute
- Subscribe to RSS Feed
- Permalink
- Report Inappropriate Content
Can see the sample QVW
- Mark as New
- Bookmark
- Subscribe
- Mute
- Subscribe to RSS Feed
- Permalink
- Report Inappropriate Content
Can see the sample QVW
- Mark as New
- Bookmark
- Subscribe
- Mute
- Subscribe to RSS Feed
- Permalink
- Report Inappropriate Content
Hi,
I'm not sure what your expressions are about. To answer your last question I've attached an example how you can cut the dimensions to one ID Value. Maybe you can elaborate on the concept of your expressions and how this is reflected in your Data Model?
Best regards
Stefan
- Mark as New
- Bookmark
- Subscribe
- Mute
- Subscribe to RSS Feed
- Permalink
- Report Inappropriate Content
Hi,
maybe the ID life column could be defined like (it seems to calculate an annual change rate of reading):
=(FirstSortedValue([Reading],-[SC Reading_DATE])-FirstSortedValue([Reading],[SC Reading_DATE]))/(Max([SC Reading_DATE])-Min([SC Reading_DATE]))*365
In your inital chart definition you have multiple occurences of ID because of multiple occurences of the SC Reading_Date dimension.
hope this helps
regards
Marco
- « Previous Replies
-
- 1
- 2
- Next Replies »