Unlock a world of possibilities! Login now and discover the exclusive benefits awaiting you.
- Qlik Community
- :
- All Forums
- :
- QlikView App Dev
- :
- Re: Exclude Results from Other Field in Select Exc...
- Subscribe to RSS Feed
- Mark Topic as New
- Mark Topic as Read
- Float this Topic for Current User
- Bookmark
- Subscribe
- Mute
- Printer Friendly Page
- Mark as New
- Bookmark
- Subscribe
- Mute
- Subscribe to RSS Feed
- Permalink
- Report Inappropriate Content
Exclude Results from Other Field in Select Excluded
Set Analysis: Show Excluded and Refine Results
This is a follow on from the above post. I have been trying to present a list of bankers who have not sold a certain product, which is defined by the user searching for the name of the product.
The solution I have reached with the help of the community is to create a pivot table with an if formula that says 'if market value of current selection >0 then 0 else 1. I have then used 'Show all values' as the dimension and suppressed zero values in the expression from the presentation tab.
The problem I have now is that when I apply an additional filter (in this case 'Region') my results still include bankers from all regions. In a similar previous question I used a syntax like this: {1<Region=$::Region>} which solved for that particular case but I cannot work out how to incorporate into my solution here.
The syntax I am using for the if statement is: IF( SUM ( {$} MKT_VAL ) > 0 , 0 ,1 ).
I have a feeling this might need an IF AND type statement when AND is current selection of region (or multiple regions)
Any pointers in right direction very much appreciated!
- « Previous Replies
-
- 1
- 2
- Next Replies »
Accepted Solutions
- Mark as New
- Bookmark
- Subscribe
- Mute
- Subscribe to RSS Feed
- Permalink
- Report Inappropriate Content
Hi Ben - I switched to SET ANALYSIS for this need.
The expression is as follows. It basically reads as ....
a) Exclude all the bankers who have sold the selected product(s) regardless of where they are
b) Out of what is left , show me only the bankers who have sold in the selected region (and other selections)
sum( {$<Product=, Banker=e( {1<Product={'$(=concat( distinct Product, chr(39)&','&chr(39)) )'} >}) >} [Market Value])
- Mark as New
- Bookmark
- Subscribe
- Mute
- Subscribe to RSS Feed
- Permalink
- Report Inappropriate Content
Are you using 'alternate states' ? Which state is the 'Region' list box using and which one is the chart using ?
- Mark as New
- Bookmark
- Subscribe
- Mute
- Subscribe to RSS Feed
- Permalink
- Report Inappropriate Content
Jonathan, thanks.
I have not setup any alternate states - just default so inherited.
I apologies but I do not totally get the use of alternate states!
- Mark as New
- Bookmark
- Subscribe
- Mute
- Subscribe to RSS Feed
- Permalink
- Report Inappropriate Content
Are you using Data islands ? Is the Region field in a table that it linked to the table where MKT_VAL resides ?
The QVW would help. 2nd to that, posting your table viewer diagram.
- Mark as New
- Bookmark
- Subscribe
- Mute
- Subscribe to RSS Feed
- Permalink
- Report Inappropriate Content
I have attached a simplified example of what I am doing to the original post above.
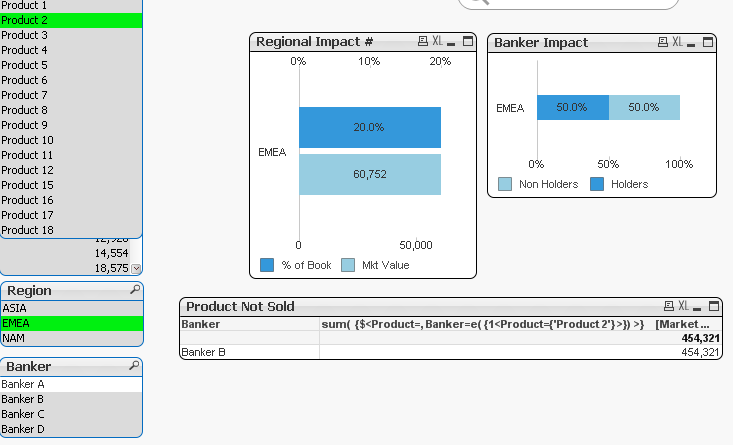
To explain the file and what is happening: When you open the file, I have 'searched' for holders of 'Product 2' across all bankers and all regions. The result show that 20% of clients in EMEA have the product and 25% in NAM (Regional Impact). At the banker level, 100% of NAM and 50% of EMEA bankers have sold the product to their client (Banker Impact). Banker A from EMEA has sold the most, then Banker C from NAM (Top Bankers by MV).
The table I am struggling with is the last one - product not sold. With no filter on region, only a filter on product it is clear that only Banker B and Banker D have not sold product 2. However, when I select region = NAM, not sold becomes Banker A, B and D. We already know Banker A has sold the product in EMEA. Because I am refining the results to NAM, this banker now appears not to have sold the product.
I think that the logic in the If statement needs some sort of element that says if the banker region is not equal to current region selection, then '0' so that all bankers will be excluded regardless of whether they have sold the product or not but I cannot work out the correct script for this.
- Mark as New
- Bookmark
- Subscribe
- Mute
- Subscribe to RSS Feed
- Permalink
- Report Inappropriate Content
Hi Ben - I switched to SET ANALYSIS for this need.
The expression is as follows. It basically reads as ....
a) Exclude all the bankers who have sold the selected product(s) regardless of where they are
b) Out of what is left , show me only the bankers who have sold in the selected region (and other selections)
sum( {$<Product=, Banker=e( {1<Product={'$(=concat( distinct Product, chr(39)&','&chr(39)) )'} >}) >} [Market Value])
- Mark as New
- Bookmark
- Subscribe
- Mute
- Subscribe to RSS Feed
- Permalink
- Report Inappropriate Content
Jonathan - I bow down to you! It works! I am not entirely clear why - what is the impact of the Prod =..Concat.. Prod section?
Also - I have setup the other parts of my analysis to allow user to also select for example an asset class and the results will show for that asset class rather than specifically for a product. Presumably this would further complicate things based on the script above!
Thanks again,
Ben
- Mark as New
- Bookmark
- Subscribe
- Mute
- Subscribe to RSS Feed
- Permalink
- Report Inappropriate Content
Hi Ben - the concat() section looks a little wordy. concat() will take every value of field (in this case product) in the current seletions and delimit them with a delimitter . In my case i want the delimitter to be ',' . So if you selected product1 and product2, the result would be a syntactically acceptable list of products for SET ANALYIS as follows. chr(39) is a single quote character so to avoid syntax issues with ',' i wrote the delimitter as chr(39)&','&chr(39). The result is something like this
Product1','Product2
Then the rest of that area has {' '} so it becomes the following which is completely valid.
{'Product1','Product2'}
To get there i tried hard coding the products first 
Do you want the Asset Class to work like Region ? Is it for the same chart ?
- Mark as New
- Bookmark
- Subscribe
- Mute
- Subscribe to RSS Feed
- Permalink
- Report Inappropriate Content
Ok - I think I get it!
Let me try to explain what I meant by including asset class. Not a deal breaker as majority of use will be via product search but would be great functionality.
On the positive side of the search, if I just select 'Equities' as an asset class, I can see for each region how much equity they hold and what proportion of the total book this is, for bankers, how many of their clients hold equities. In a similar approach to using a product, I might just want to see all bankers who have not sold Equities to any of their clients. I could modify the function above and switch Product for Asset Class and this should work the same way, but then I would have to define a separate piece of code for each field I wanted to be able to show in this way.
Is making something this generic a realistic possibility? If this is opening up a can of worms I will leave for 'phase 2', im just curious to see how far it is possible to push this approach. Even just including Product plus asset class would show me how I can build up to include other possible fields in the future.
Thanks,
Ben
- Mark as New
- Bookmark
- Subscribe
- Mute
- Subscribe to RSS Feed
- Permalink
- Report Inappropriate Content
Would it be for the same chart ? So that :
a) E xclude all the bankers who have sold the selected product(s) and/or asset classes regardless of where they are
b) Out of what is left , show me only the bankers who have sold in the selected region (and other selections)
Or a different chart that only looks at asset classes (instead of products) ?
i don't mind making another example based on your answer
- « Previous Replies
-
- 1
- 2
- Next Replies »