Unlock a world of possibilities! Login now and discover the exclusive benefits awaiting you.
- Qlik Community
- :
- All Forums
- :
- QlikView App Dev
- :
- Re: Cumulative time graph
- Subscribe to RSS Feed
- Mark Topic as New
- Mark Topic as Read
- Float this Topic for Current User
- Bookmark
- Subscribe
- Mute
- Printer Friendly Page
- Mark as New
- Bookmark
- Subscribe
- Mute
- Subscribe to RSS Feed
- Permalink
- Report Inappropriate Content
Cumulative time graph
We want to follow the evolution of the customers who had buyed last year and who came back this year until the month we selected.
We wrote this formula :
Count({< IDC = P({<IDC -= {'0'}, Annee={$(=Max(Annee))}>} IDC)*P({<IDC -= {'0'}, Annee={$(=Max(Annee)-1)}>} IDC)>} distinct IDC)
It work fine.
But, when we put it in a bar graph, we don't have the same result :
When we select 1 month : OK
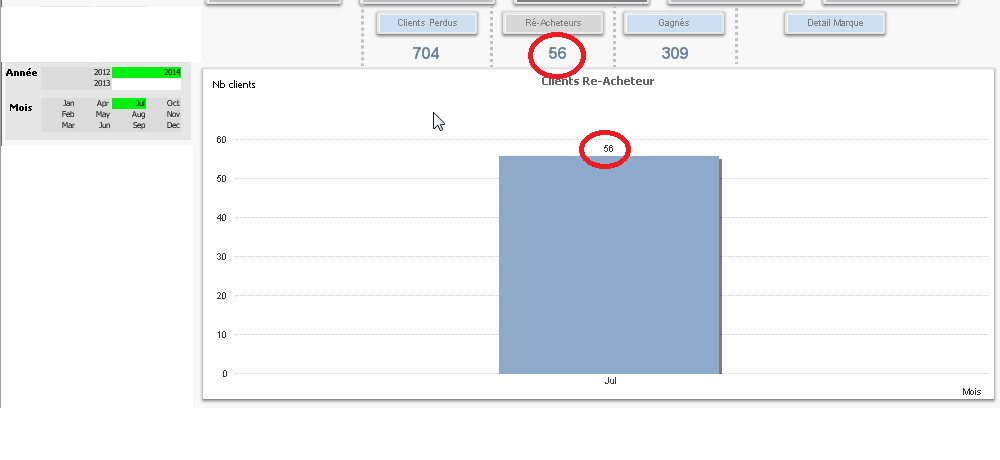
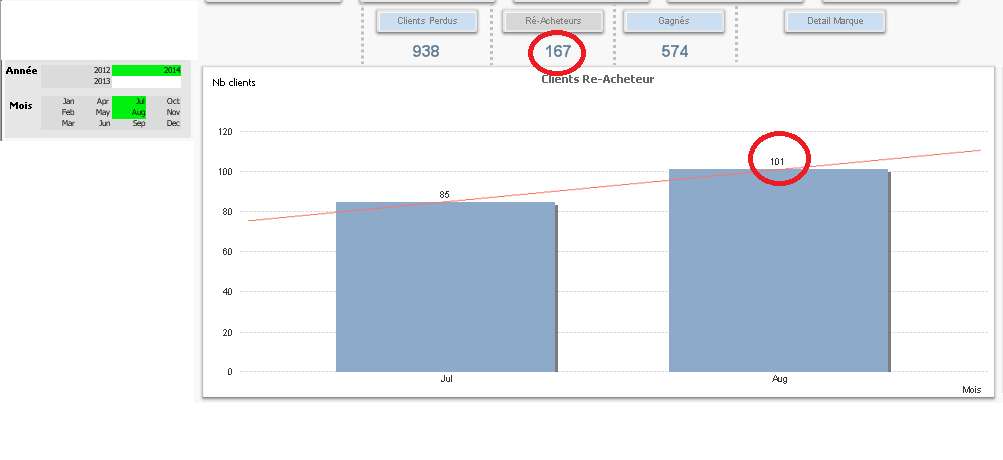
But, when we select 2 month, the result is wrong in the bar graph :
The result is false for the last month, and the first month is not good.
can somebody help me ?
Thanks.
Regards.
- Mark as New
- Bookmark
- Subscribe
- Mute
- Subscribe to RSS Feed
- Permalink
- Report Inappropriate Content
i think the problem is there is no intersect between the first month and the second month. How can i modify the formula to make this intersect in the graph :
First month = first month
Second month = intersect ( intersect(M1 2014, M2 2014), 2013)
Thanks
- Mark as New
- Bookmark
- Subscribe
- Mute
- Subscribe to RSS Feed
- Permalink
- Report Inappropriate Content
please post sample application
thanks
cordialement
Marco