Unlock a world of possibilities! Login now and discover the exclusive benefits awaiting you.
- Qlik Community
- :
- All Forums
- :
- QlikView App Dev
- :
- Re: Graph not showing all data points
- Subscribe to RSS Feed
- Mark Topic as New
- Mark Topic as Read
- Float this Topic for Current User
- Bookmark
- Subscribe
- Mute
- Printer Friendly Page
- Mark as New
- Bookmark
- Subscribe
- Mute
- Subscribe to RSS Feed
- Permalink
- Report Inappropriate Content
Graph not showing all data points
Hi,
I have a graph that isn't showing all the values. If I enable horizontal scrolling, then the values appear when I scroll horizontally, but I would wish them to all show up without scrolling.
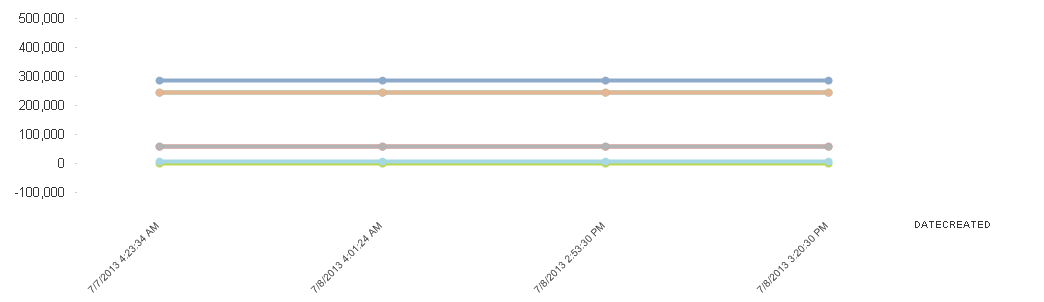
If I check off 'continuous' from the axes tab, then all the values show, however, the scale doesn't show up properly.
Without continuous:
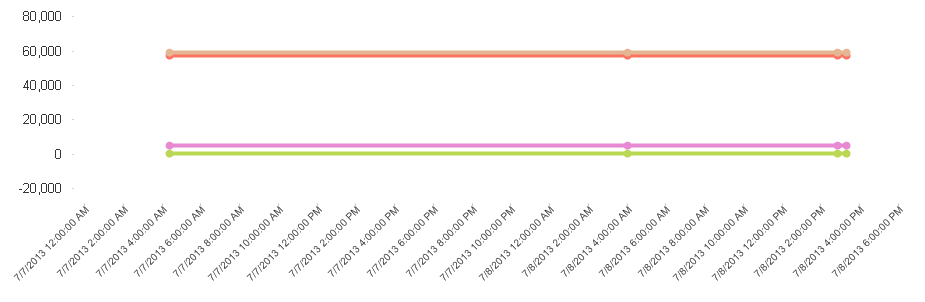
With Continuous:
How do I make all the values show up on the graph?
- Mark as New
- Bookmark
- Subscribe
- Mute
- Subscribe to RSS Feed
- Permalink
- Report Inappropriate Content
A very late answer but for my own reference or anyone elses...
For QlikView 11 go to Properties
-> Chart Type change to Bar Chart
-> in Presention upper left corner Bar Settings click Show All Bars
-> back to Chart Type change back to Line Chart
Line chart with all values displayed
- Mark as New
- Bookmark
- Subscribe
- Mute
- Subscribe to RSS Feed
- Permalink
- Report Inappropriate Content
If that works, I'll need to file that tip away. That's an odd fix. Seems "buggy," but if it works, it works.
- Mark as New
- Bookmark
- Subscribe
- Mute
- Subscribe to RSS Feed
- Permalink
- Report Inappropriate Content
That's why I put it up in an old question. Really useful but "buggy" as you say. The next time I need it I can just review my questions 