Unlock a world of possibilities! Login now and discover the exclusive benefits awaiting you.
- Qlik Community
- :
- All Forums
- :
- QlikView App Dev
- :
- Re: Show hidden values in pivot table
- Subscribe to RSS Feed
- Mark Topic as New
- Mark Topic as Read
- Float this Topic for Current User
- Bookmark
- Subscribe
- Mute
- Printer Friendly Page
- Mark as New
- Bookmark
- Subscribe
- Mute
- Subscribe to RSS Feed
- Permalink
- Report Inappropriate Content
Show hidden values in pivot table
Hello everyone,
So I am having some trouble with null values in pivot and straight tables.
On the table box that follows I show 3 time values, but I want to use pivot or straight tables because I have to color cell based on a result.
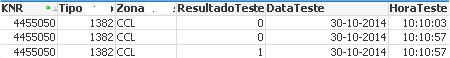
My problem is that both the pivot table and the straight table join two time results and show a dash ( - ) or 'null' instead.
How can I show all the values with the pivot or straight table?
Straight table:

Pivot table:

Thanks in advance.
Best regards,
Ivo Marques
Accepted Solutions
- Mark as New
- Bookmark
- Subscribe
- Mute
- Subscribe to RSS Feed
- Permalink
- Report Inappropriate Content
Try Adding all dimensions to left including Hora Teste and hide expression under Presentation tab using Hide Column option
- Mark as New
- Bookmark
- Subscribe
- Mute
- Subscribe to RSS Feed
- Permalink
- Report Inappropriate Content
Hi,
What is the expression you are using.
Tablebox will show just the data from the fields selected
But in straight table or Pivot you need to specify an expression either count,sum,avg(some aggregation)
- Mark as New
- Bookmark
- Subscribe
- Mute
- Subscribe to RSS Feed
- Permalink
- Report Inappropriate Content
Hi,
The expression I am using is only a field:
HoraTeste
I am not using an expression with count, cum, avg, etc
- Mark as New
- Bookmark
- Subscribe
- Mute
- Subscribe to RSS Feed
- Permalink
- Report Inappropriate Content
Try Adding all dimensions to left including Hora Teste and hide expression under Presentation tab using Hide Column option
- Mark as New
- Bookmark
- Subscribe
- Mute
- Subscribe to RSS Feed
- Permalink
- Report Inappropriate Content
Well that is a nice little trick and it works for what I want!
Thank you!