Unlock a world of possibilities! Login now and discover the exclusive benefits awaiting you.
- Qlik Community
- :
- Forums
- :
- Analytics
- :
- New to Qlik Analytics
- :
- Re: Re: How to show 2 years of data in a bar chart
- Subscribe to RSS Feed
- Mark Topic as New
- Mark Topic as Read
- Float this Topic for Current User
- Bookmark
- Subscribe
- Mute
- Printer Friendly Page
- Mark as New
- Bookmark
- Subscribe
- Mute
- Subscribe to RSS Feed
- Permalink
- Report Inappropriate Content
How to show 2 years of data in a bar chart
I'm pretty new to all this, so apologies if this sounds simple.
I currently have my data set up with a field for month and a field for year. I would like to show in a bar chart the sales by month for the two years so that sales for each month are side by side.
At the moment the dimension is month, so its adding the 2 years together. Can this be done?
Accepted Solutions
- Mark as New
- Bookmark
- Subscribe
- Mute
- Subscribe to RSS Feed
- Permalink
- Report Inappropriate Content
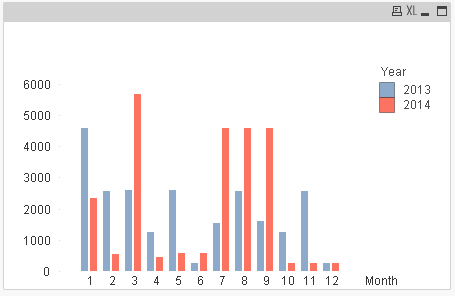
Yes it will worked the chart is look like different because there is no values in some months let see for all months value
LOAD Year,Month,Sales,Year&Month as YrMonth;
LOAD * INLINE [
Year, Month, Sales
2014, 1, 2345
2014, 2, 546
2014, 3, 5657
2014, 4, 456
2014, 5, 565
2014, 6, 564
2014, 7, 4566
2014, 8, 4567
2014, 9, 4586
2014, 10, 256
2014, 11, 258
2014, 12, 266
2013,1,4589
2013,2,2563
2013,3,2587
2013,4,1256
2013,5,2593
2013,6,247
2013,7,1523
2013,8,2562
2013,9,1587
2013,10,1256
2013,11,2563
2013,12,254
];
And Expression:- Expression:- Sum({<Year = {'<=$(=Max(Year)) >=$(=Max(Year)-1) '}>} Sales)
Regards
Anand
- Mark as New
- Bookmark
- Subscribe
- Mute
- Subscribe to RSS Feed
- Permalink
- Report Inappropriate Content
Provide any sample data will works better.
Regards
Anand
- Mark as New
- Bookmark
- Subscribe
- Mute
- Subscribe to RSS Feed
- Permalink
- Report Inappropriate Content
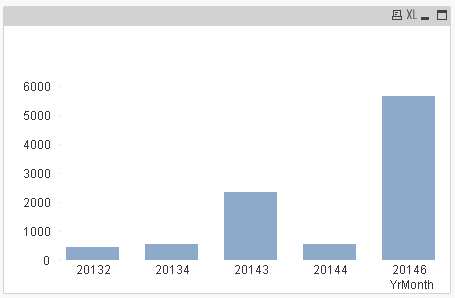
You can refer this simple example also
LOAD Year,Month,Sales,Year&Month as YrMonth;
LOAD * Inline
[
Year,Month,Sales
2014,3,2345
2014,4,546
2014,6,5657
2013,2,456
2013,4,565
2012,6,564
2012,2,4566
2012,7,4567
];
And in the Bar chart use dimensions and expression
Dimension:- Year
Expression:- Sum({<Year = {'<=$(=Max(Year)) >=$(=Max(Year)-1) '}>} Sales)
Regards
Anand
- Mark as New
- Bookmark
- Subscribe
- Mute
- Subscribe to RSS Feed
- Permalink
- Report Inappropriate Content
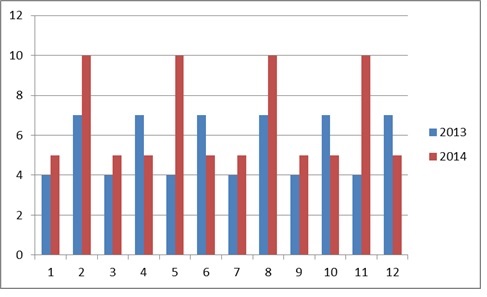
That's more or less, but I want the chart to look like this:
- Mark as New
- Bookmark
- Subscribe
- Mute
- Subscribe to RSS Feed
- Permalink
- Report Inappropriate Content
Yes it will worked the chart is look like different because there is no values in some months let see for all months value
LOAD Year,Month,Sales,Year&Month as YrMonth;
LOAD * INLINE [
Year, Month, Sales
2014, 1, 2345
2014, 2, 546
2014, 3, 5657
2014, 4, 456
2014, 5, 565
2014, 6, 564
2014, 7, 4566
2014, 8, 4567
2014, 9, 4586
2014, 10, 256
2014, 11, 258
2014, 12, 266
2013,1,4589
2013,2,2563
2013,3,2587
2013,4,1256
2013,5,2593
2013,6,247
2013,7,1523
2013,8,2562
2013,9,1587
2013,10,1256
2013,11,2563
2013,12,254
];
And Expression:- Expression:- Sum({<Year = {'<=$(=Max(Year)) >=$(=Max(Year)-1) '}>} Sales)
Regards
Anand