Unlock a world of possibilities! Login now and discover the exclusive benefits awaiting you.
- Qlik Community
- :
- All Forums
- :
- QlikView App Dev
- :
- Re: Values in Line Chart
- Subscribe to RSS Feed
- Mark Topic as New
- Mark Topic as Read
- Float this Topic for Current User
- Bookmark
- Subscribe
- Mute
- Printer Friendly Page
- Mark as New
- Bookmark
- Subscribe
- Mute
- Subscribe to RSS Feed
- Permalink
- Report Inappropriate Content
Values in Line Chart
Hi experts
I have the following problem:
I created a line chart kumulating values. Problem is, the lines are not continued once there is no value added in a month. Is the a wasy to fix this problem?

Thank you for your help!
Jan
Accepted Solutions
- Mark as New
- Bookmark
- Subscribe
- Mute
- Subscribe to RSS Feed
- Permalink
- Report Inappropriate Content
Hi,
You are right, MyExpression is just the name to reference from other expressions/calculations.
So when you say Above(MyExpression) it goes and gets the data right above/before current place in your chart. So it is the previous value of the expression.
And RangeSum sums ABOVE value and current value to make accumulated values in your cells.
Is it clear or needs further explanation?
Ersen
- Mark as New
- Bookmark
- Subscribe
- Mute
- Subscribe to RSS Feed
- Permalink
- Report Inappropriate Content
Hi,
Try changing the presentation options of the line in the expressions tab of chart's properties.
Marc.
- Mark as New
- Bookmark
- Subscribe
- Mute
- Subscribe to RSS Feed
- Permalink
- Report Inappropriate Content
Are you pulling month dimension from a dimension table?
I assume
Try writing cumulative expression label it so you can refer it with above.
Choose No Accumulate
Label = MyCumExpression
Expression =rangeSum(Sum(MyMeasure), above(MyCumExpression))
this way you will produce accumulated numbers always
- Mark as New
- Bookmark
- Subscribe
- Mute
- Subscribe to RSS Feed
- Permalink
- Report Inappropriate Content
Hi Ersen
You are right, my dimension is month.
I already have a complex expression : Sum ({<Jahr={$(VmaxJahr)}>} ([Rohertrag_AP]))
I am not sure how to integrate your text in my expression... 
What does MyCumExpression do?
Thank you for your help!
Jan
- Mark as New
- Bookmark
- Subscribe
- Mute
- Subscribe to RSS Feed
- Permalink
- Report Inappropriate Content
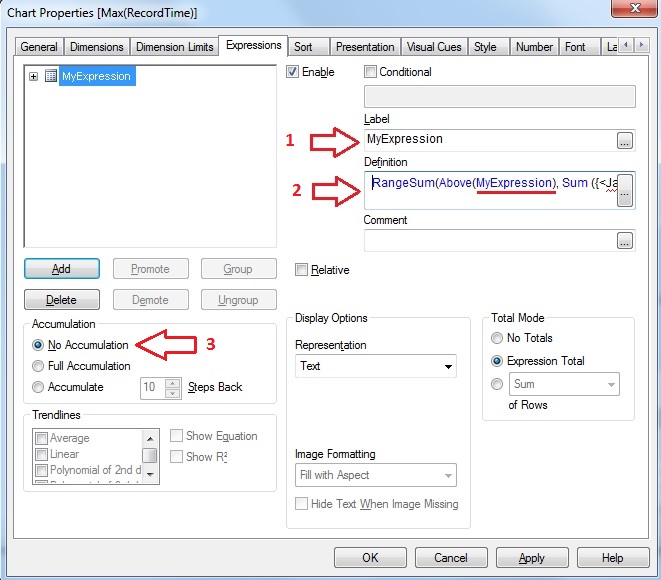
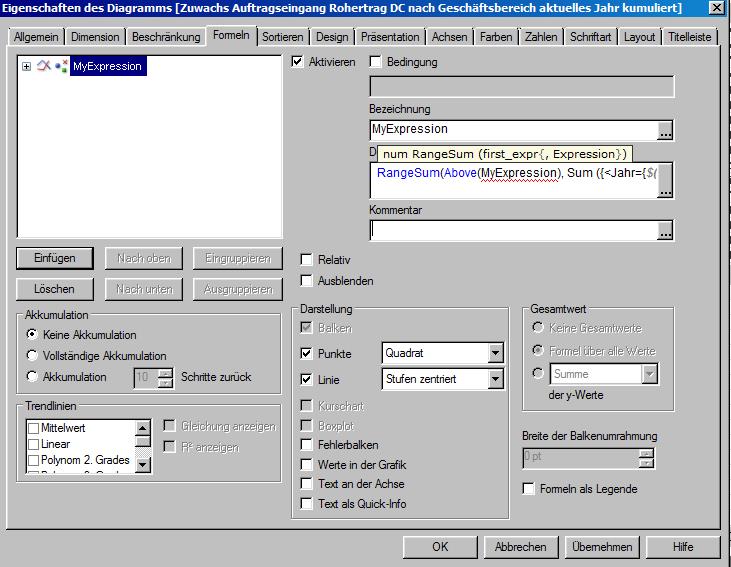
It is the Label of your expression.
First: Label your expression as MyExpression
Then: Keep your expression and wrap with red areas below into Definition:
RangeSum(Above(MyExpression), Sum ({<Jahr={$(VmaxJahr)}>} ([Rohertrag_AP])) )
3 - Make sure No Accumulation is picked
- Mark as New
- Bookmark
- Subscribe
- Mute
- Subscribe to RSS Feed
- Permalink
- Report Inappropriate Content
Hi Ersen
It looks good to me but I still do not understand the function of "MyExpression". Is this supposed to be the range in which I want to show values? The label only gives the name for the function, right?
Best
Jan
- Mark as New
- Bookmark
- Subscribe
- Mute
- Subscribe to RSS Feed
- Permalink
- Report Inappropriate Content
As suggested above you can use expression to implement the accumulation.
Where try using any supress null() settings at dimension as well as presentation level.
- Mark as New
- Bookmark
- Subscribe
- Mute
- Subscribe to RSS Feed
- Permalink
- Report Inappropriate Content
Hi,
You are right, MyExpression is just the name to reference from other expressions/calculations.
So when you say Above(MyExpression) it goes and gets the data right above/before current place in your chart. So it is the previous value of the expression.
And RangeSum sums ABOVE value and current value to make accumulated values in your cells.
Is it clear or needs further explanation?
Ersen