Unlock a world of possibilities! Login now and discover the exclusive benefits awaiting you.
- Qlik Community
- :
- All Forums
- :
- QlikView App Dev
- :
- Re: Re: Re: two histograms on a single graph
- Subscribe to RSS Feed
- Mark Topic as New
- Mark Topic as Read
- Float this Topic for Current User
- Bookmark
- Subscribe
- Mute
- Printer Friendly Page
- Mark as New
- Bookmark
- Subscribe
- Mute
- Subscribe to RSS Feed
- Permalink
- Report Inappropriate Content
two histograms on a single graph
Hi All,
I'm struggling to put two histogram line graphs in a single chart. Basically I have two sets of values with the same dimensional unit.
Let's say v1 and v2 for each of the sets. I could make a graph with one variable as defining the dimension as Round(v1, 1) and count the entries in the expressions. And then, how can I put the second one ?
Thanks,
Ray
Accepted Solutions
- Mark as New
- Bookmark
- Subscribe
- Mute
- Subscribe to RSS Feed
- Permalink
- Report Inappropriate Content
To achieve a better performance when using large tables, you could pre calculate the value classes in the script:
tabData:
CrossTable (type, value)
LOAD RecNo() as ID,
    NORMINV(Rand(),5,2) as value1,
    NORMINV(Rand(),6,1) as value2
AutoGenerate 100000;

Left Join
LOAD Distinct
  value,
  Round(value, 0.1) as value_class
Resident tabData;
hope this helps
regards
Marco
- Mark as New
- Bookmark
- Subscribe
- Mute
- Subscribe to RSS Feed
- Permalink
- Report Inappropriate Content
You could crosstable load a key field and your fields 1 and 2 to create a combined field and a type field to distinct the origins.
you then would create your buckets using round or class or something like this using the combined field instead of only field 1. your type field would be the second dimension. Your counting expression could remain the same (maybe adjusted to the new fieldnames).
please post sample data to demonstrate.
thanks
regards
Marco
- Mark as New
- Bookmark
- Subscribe
- Mute
- Subscribe to RSS Feed
- Permalink
- Report Inappropriate Content
Thanks Marco for taking a time for answering my question. I never used the crosstable and search for it and tried but couldn't get what I wanted. It will be appreciated if you give some more hints. For the data privacy issue, hard to share the numbers. Instead, simply you can generate two sets of numbers by, say, normal distribution with different parameters.
regards,
Ray
- Mark as New
- Bookmark
- Subscribe
- Mute
- Subscribe to RSS Feed
- Permalink
- Report Inappropriate Content
Hi,
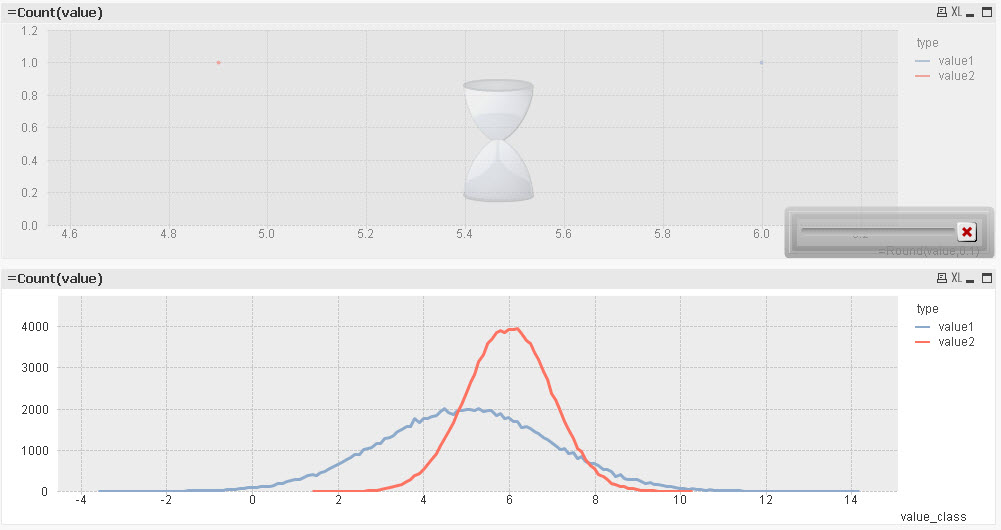
one possible solution could be then:
tabData:
CrossTable (type, value)
LOAD RecNo() as ID,
    NORMINV(Rand(),5,2) as value1,
    NORMINV(Rand(),6,1) as value2
AutoGenerate 100000;
hope this helps
regards
Marco
- Mark as New
- Bookmark
- Subscribe
- Mute
- Subscribe to RSS Feed
- Permalink
- Report Inappropriate Content
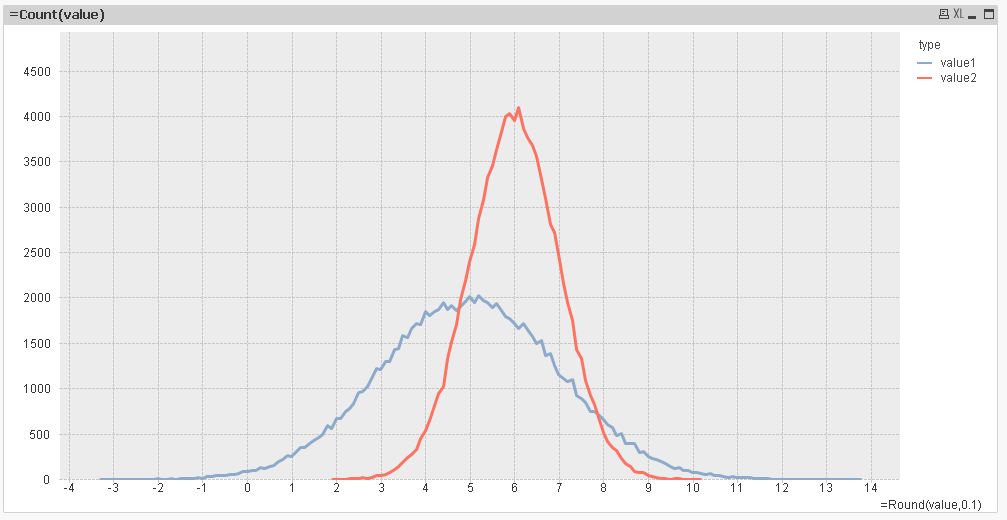
To achieve a better performance when using large tables, you could pre calculate the value classes in the script:
tabData:
CrossTable (type, value)
LOAD RecNo() as ID,
    NORMINV(Rand(),5,2) as value1,
    NORMINV(Rand(),6,1) as value2
AutoGenerate 100000;

Left Join
LOAD Distinct
  value,
  Round(value, 0.1) as value_class
Resident tabData;
hope this helps
regards
Marco
- Mark as New
- Bookmark
- Subscribe
- Mute
- Subscribe to RSS Feed
- Permalink
- Report Inappropriate Content
Marco,
I appreciate your help. It works perfect! and I learned something from your code.
Have a great day!
Ray