Unlock a world of possibilities! Login now and discover the exclusive benefits awaiting you.
- Qlik Community
- :
- All Forums
- :
- QlikView App Dev
- :
- Re: Area & Line Chart Combo
- Subscribe to RSS Feed
- Mark Topic as New
- Mark Topic as Read
- Float this Topic for Current User
- Bookmark
- Subscribe
- Mute
- Printer Friendly Page
- Mark as New
- Bookmark
- Subscribe
- Mute
- Subscribe to RSS Feed
- Permalink
- Report Inappropriate Content
Area & Line Chart Combo
Fellow Qlikviewers,
as per request I am trying to convert some Excel-graphs into our Qlikview environment.
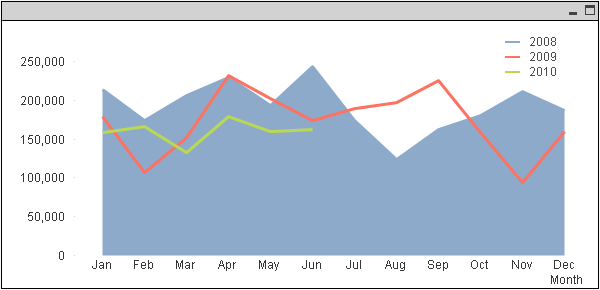
We have several graphs that use a combination of a Area-chart and a Line-chart (see image below).
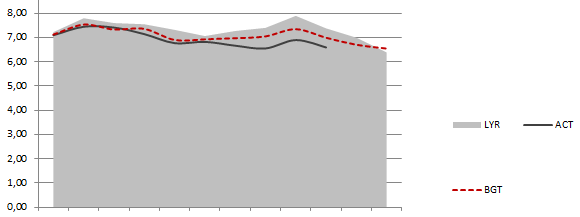
I have not yet found the option to create a graph that will do both.
Does anyone have a solution / workaround?
Thanks in advance for any help/suggestion!
- Mark as New
- Bookmark
- Subscribe
- Mute
- Subscribe to RSS Feed
- Permalink
- Report Inappropriate Content
The workaround is to put two charts on top of each other. See attached example
talk is cheap, supply exceeds demand
- Mark as New
- Bookmark
- Subscribe
- Mute
- Subscribe to RSS Feed
- Permalink
- Report Inappropriate Content
Gysbert, thanks for you help! One slight problem: we are still waiting for the Qlikview Licenses, so at the moment I'm working on a free version and can't open your file. Would it be possible to explain shortly how you make two charts on top of each other? Thanks in advance again!
- Mark as New
- Bookmark
- Subscribe
- Mute
- Subscribe to RSS Feed
- Permalink
- Report Inappropriate Content
Any luck with explaining 'in words' how to do this?
Thanks again! 
- Mark as New
- Bookmark
- Subscribe
- Mute
- Subscribe to RSS Feed
- Permalink
- Report Inappropriate Content
Hi Stefan,
Try to create two different graph 1. Line chart and other Area chart with same dimension and expression.Place them on each other.
And yes , you have to set transperancy to 100% for one chart.
Hope it helps.
Regards
KC
KC
- Mark as New
- Bookmark
- Subscribe
- Mute
- Subscribe to RSS Feed
- Permalink
- Report Inappropriate Content
hi Gysbert,
I too need a combo of line and area chart in a single graph,Can you elaborate on what you are trying to convey...Thanx in advance