Unlock a world of possibilities! Login now and discover the exclusive benefits awaiting you.
- Qlik Community
- :
- All Forums
- :
- QlikView App Dev
- :
- Re: Qlikview beginner
- Subscribe to RSS Feed
- Mark Topic as New
- Mark Topic as Read
- Float this Topic for Current User
- Bookmark
- Subscribe
- Mute
- Printer Friendly Page
- Mark as New
- Bookmark
- Subscribe
- Mute
- Subscribe to RSS Feed
- Permalink
- Report Inappropriate Content
Qlikview beginner
HELLO EVERYONE
Im new to qlikview
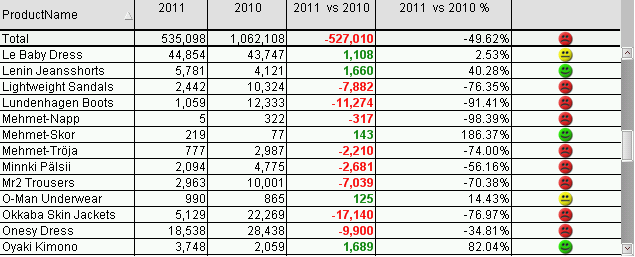
i tried to make a Straight Table but couldn't make it
need your help !!!!
attached file
tnx Avi@@@@
- « Previous Replies
-
- 1
- 2
- Next Replies »
- Mark as New
- Bookmark
- Subscribe
- Mute
- Subscribe to RSS Feed
- Permalink
- Report Inappropriate Content
what you are trying to achieve by the straight table.
- Mark as New
- Bookmark
- Subscribe
- Mute
- Subscribe to RSS Feed
- Permalink
- Report Inappropriate Content
How did you get the happy sad face column
- Mark as New
- Bookmark
- Subscribe
- Mute
- Subscribe to RSS Feed
- Permalink
- Report Inappropriate Content
based on which condition u want that images
- Mark as New
- Bookmark
- Subscribe
- Mute
- Subscribe to RSS Feed
- Permalink
- Report Inappropriate Content
HI Sasi
it's an assignment need to be done as is in the picture
sum of 2011,2010
column of year 2011 vs 2010 and also in %
and last column adding pic that indicates if there is positive or negative growth
tnx Avi
- Mark as New
- Bookmark
- Subscribe
- Mute
- Subscribe to RSS Feed
- Permalink
- Report Inappropriate Content
create one new expression with the condition required.
expand the options of expression.Backgroud color->definition->select images tab.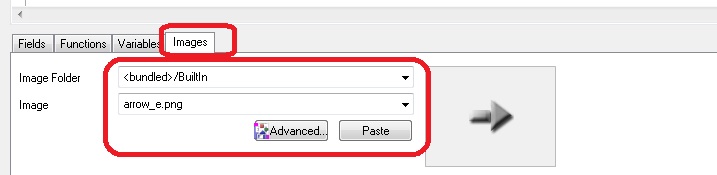
Here u can find all the smiley symbols.
Hope this helps.
- Mark as New
- Bookmark
- Subscribe
- Mute
- Subscribe to RSS Feed
- Permalink
- Report Inappropriate Content
I can't open your file (I'm at home)
But I never knew there was an option to have a face in QV. And can't find it
Thanks
- Mark as New
- Bookmark
- Subscribe
- Mute
- Subscribe to RSS Feed
- Permalink
- Report Inappropriate Content
Thanks
- Mark as New
- Bookmark
- Subscribe
- Mute
- Subscribe to RSS Feed
- Permalink
- Report Inappropriate Content
Hi Sasi
im in a bigger problem
i cant deal with the basics of this tabele
like how do i show year only 2011
and how do i compare them
tnx Avi
- Mark as New
- Bookmark
- Subscribe
- Mute
- Subscribe to RSS Feed
- Permalink
- Report Inappropriate Content
n the script u can create one new field with condition that year=2011.
So that u can use that field in the chart.
Table_1:
LOAD
Year,
Month
If(Year = 2011) as Year_1
From table_1;
So that we can use Year_1 in chart so that it will show only year 2011
- « Previous Replies
-
- 1
- 2
- Next Replies »