Unlock a world of possibilities! Login now and discover the exclusive benefits awaiting you.
- Qlik Community
- :
- All Forums
- :
- QlikView App Dev
- :
- Re: Statistics of all applications
- Subscribe to RSS Feed
- Mark Topic as New
- Mark Topic as Read
- Float this Topic for Current User
- Bookmark
- Subscribe
- Mute
- Printer Friendly Page
- Mark as New
- Bookmark
- Subscribe
- Mute
- Subscribe to RSS Feed
- Permalink
- Report Inappropriate Content
Statistics of all applications
Hi,
Good Morning.I need your help.
I have to create one application.i have around 30 applications in my server and they are used in QMC for scheduling.Some of applications are scheduled on dependency in Qmc also.
I need to show all the applications start of execution and end of execution.
Need history for last one month to observe the statistics and take care of performance if in case it takes more time.
We can find from log files but that manual process and time consuming.
I read governance dashboard but that will give only app statistics.
More Thanks,
Ajay
- « Previous Replies
-
- 1
- 2
- Next Replies »
- Mark as New
- Bookmark
- Subscribe
- Mute
- Subscribe to RSS Feed
- Permalink
- Report Inappropriate Content
Try with new version of governance Dashboard
You need to be a partner or customer to download the same.
Regards
ASHFAQ
- Mark as New
- Bookmark
- Subscribe
- Mute
- Subscribe to RSS Feed
- Permalink
- Report Inappropriate Content
Thanks Jagan,
Currently am unable to download the application.
It will be great if your sharing the sample app with the log files of your any test application..
I need to see all my apps statistics.
Thanks,
Ajay
- Mark as New
- Bookmark
- Subscribe
- Mute
- Subscribe to RSS Feed
- Permalink
- Report Inappropriate Content
- Mark as New
- Bookmark
- Subscribe
- Mute
- Subscribe to RSS Feed
- Permalink
- Report Inappropriate Content
You can also calculate this yourself in a quite simple app - just read the log files in C:\programdata\qliktech\distributionservice\1\Log\<Folder with date of job>
- Mark as New
- Bookmark
- Subscribe
- Mute
- Subscribe to RSS Feed
- Permalink
- Report Inappropriate Content
Hi,
Check this links
http://community.qlik.com/docs/DOC-6699
http://community.qlik.com/docs/DOC-6725
Regards,
Jagan.
- Mark as New
- Bookmark
- Subscribe
- Mute
- Subscribe to RSS Feed
- Permalink
- Report Inappropriate Content
Thanks Morgan.That is manual way to check all apps.
We need to get the all the apps times from C:\programdata\qliktech\distributionservice\1\Log\<Folder with date of job>
I hope you understand.
Ajay
- Mark as New
- Bookmark
- Subscribe
- Mute
- Subscribe to RSS Feed
- Permalink
- Report Inappropriate Content
Hi Ajay,
Please find attached file.
Regards,
Jagan.
- Mark as New
- Bookmark
- Subscribe
- Mute
- Subscribe to RSS Feed
- Permalink
- Report Inappropriate Content
Thnaks Jagan...
I had seen this application and by luck am also have same app.
But in this we cant find the one application whats the last one month start time and end time ...i guess
Thanks,
Ajay
- Mark as New
- Bookmark
- Subscribe
- Mute
- Subscribe to RSS Feed
- Permalink
- Report Inappropriate Content
Hi,
You can change the charts as per your requirement, you have all the date fields in the data.
Regards,
Jagan.
- Mark as New
- Bookmark
- Subscribe
- Mute
- Subscribe to RSS Feed
- Permalink
- Report Inappropriate Content
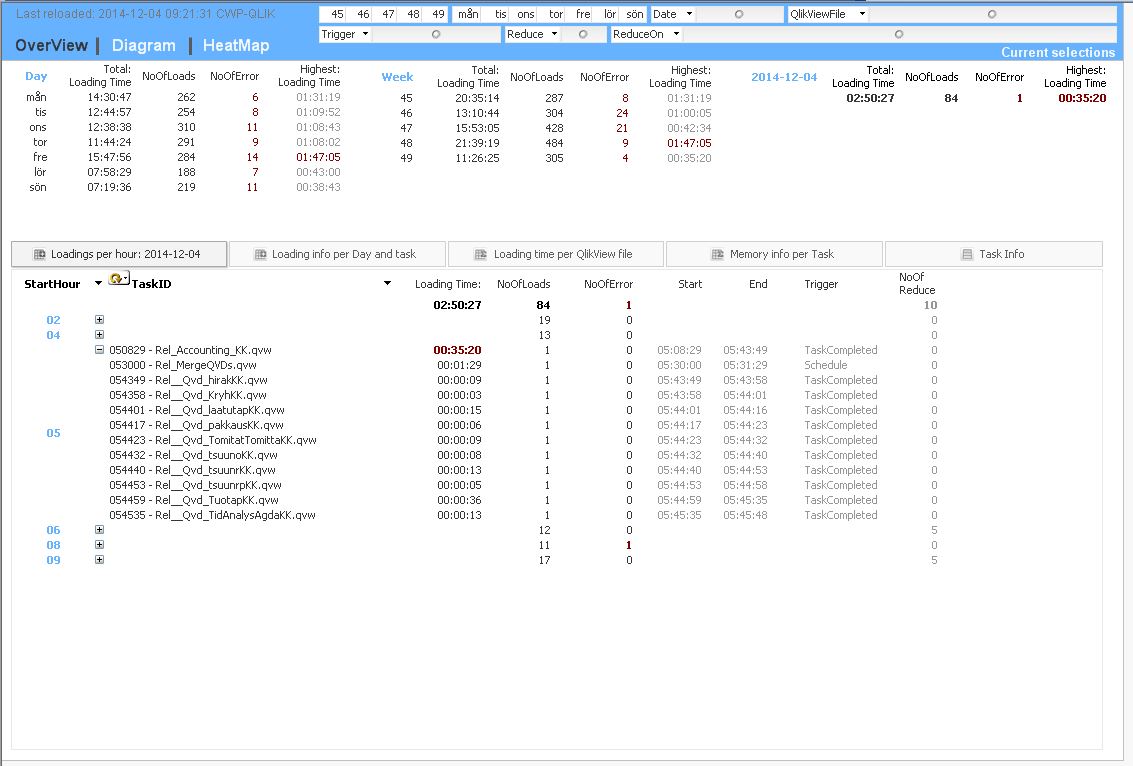
By reading the logfiles as Morgan mention it is possible to create a really powerful tool with loading time per task/file, memory before load, qvb.exe info etc, etc
- « Previous Replies
-
- 1
- 2
- Next Replies »