Unlock a world of possibilities! Login now and discover the exclusive benefits awaiting you.
- Qlik Community
- :
- Discover
- :
- Programs
- :
- Education
- :
- Qlik Education Discussions
- :
- Re: Dynamically, can we set string literal as Y -c...
- Subscribe to RSS Feed
- Mark Topic as New
- Mark Topic as Read
- Float this Topic for Current User
- Bookmark
- Subscribe
- Mute
- Printer Friendly Page
- Mark as New
- Bookmark
- Subscribe
- Mute
- Subscribe to RSS Feed
- Permalink
- Report Inappropriate Content
Dynamically, can we set string literal as Y -cordinates in Scatter Chart
As per the Attached QVW document , wanted a Practice Name (string literal) on Y-coordinates under scatter chart, is there any way to do it dynamically
one workaround way is there , we embedded all Practice Name manually into the Input box spacing/fitting it correctly which could be aligned with the Y-coordinates as shown under this snippet.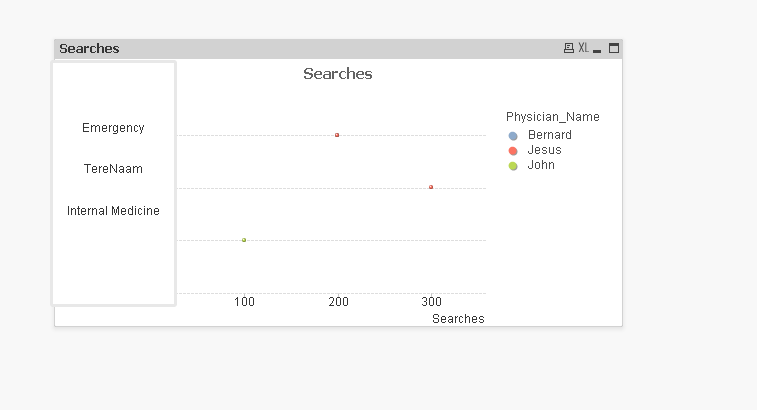
Kindly please advise
- Mark as New
- Bookmark
- Subscribe
- Mute
- Subscribe to RSS Feed
- Permalink
- Report Inappropriate Content
Hi, why don't you try a symbol line chart, that would look exactly like you are after, 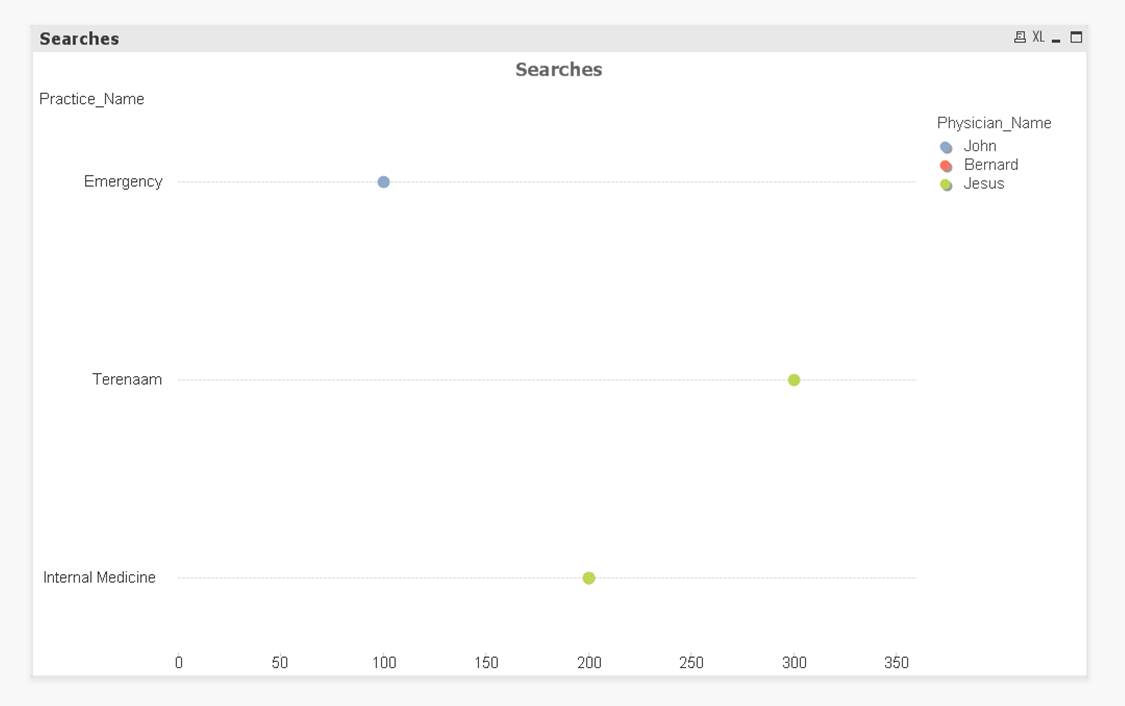
- Mark as New
- Bookmark
- Subscribe
- Mute
- Subscribe to RSS Feed
- Permalink
- Report Inappropriate Content
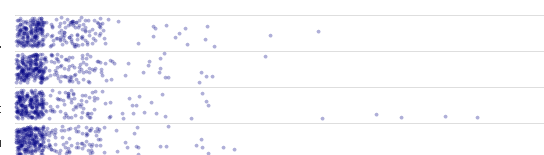
Many Thanks . one question we would like to pose is , is there any way where we can draw Dots/Bubbles inside each swimming lane , similar to this below snippets rather than on the line edges.
Awaiting your favorable response.
- Mark as New
- Bookmark
- Subscribe
- Mute
- Subscribe to RSS Feed
- Permalink
- Report Inappropriate Content
thanks, got the answer to my own Questions..
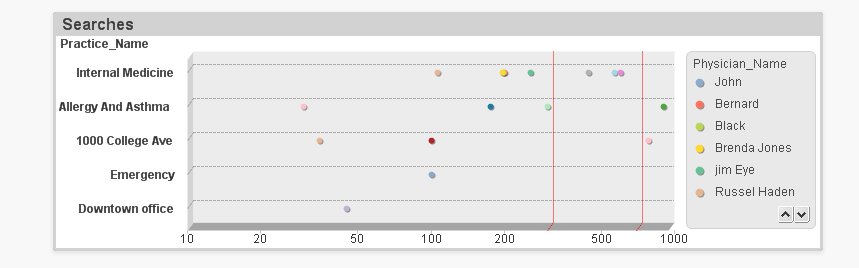
we did , under line chart ->style->Increase the Top Angle 3d view to 37 and side Angle to 15 and accordingly all dots is coming under each swimming lane now .