Unlock a world of possibilities! Login now and discover the exclusive benefits awaiting you.
- Qlik Community
- :
- All Forums
- :
- QlikView App Dev
- :
- Re: A few bivalent nominal variables into one dime...
- Subscribe to RSS Feed
- Mark Topic as New
- Mark Topic as Read
- Float this Topic for Current User
- Bookmark
- Subscribe
- Mute
- Printer Friendly Page
- Mark as New
- Bookmark
- Subscribe
- Mute
- Subscribe to RSS Feed
- Permalink
- Report Inappropriate Content
A few bivalent nominal variables into one dimension
Hi,
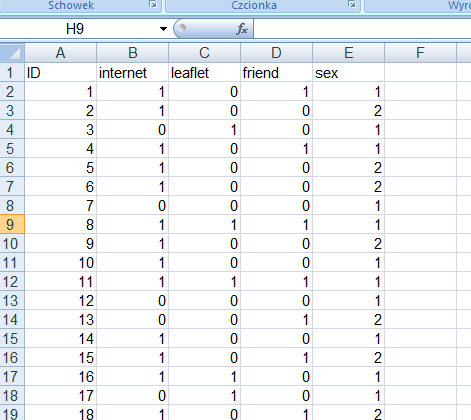
Is it possible to work on Qlik Sense with data coded like that:
(variables [internet; leaflet; friend; sex] in bivalent nominal scales)
and generate in QlikSense sheet charts like these below, cooperating each other (I mean interacting like it is beetwen charts in QS demo app's):
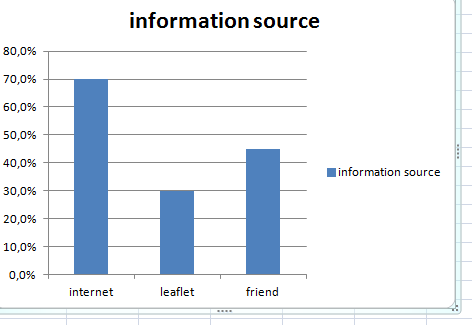
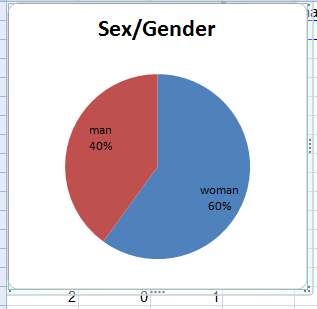
In other words, is this possible to turn the variables [internet; leaflet; friend] into one dimension [eg. info source] and take their average value as a measure, and at the same time, be able to categorize this comparision by the [sex] variable.
Well, hope I'm not confusing and the question is interesting. I'm a beginer in data mining but I'm open to every solution - even the most mysterious script 
Thanks for help
All the best
Przemyslav
Accepted Solutions
- Mark as New
- Bookmark
- Subscribe
- Mute
- Subscribe to RSS Feed
- Permalink
- Report Inappropriate Content
Hi Przemyslav,
I would recommend split the table into two tables and joining them on ID. One table, I've called People and the other I've call InfoSource. I've also done a mapping to convert the numeric representation of gender to words.
Below is the script I used and I've also attached the data and QVF.
Please make this response and helpful or correct if applicable to help out other member when search for answers.
-Josh
Qlik
TempData1:
LOAD
ID,
Internet,
Leaflet,
Friend,
Sex
FROM [lib://Desktop/Data.xlsx]
(ooxml, embedded labels, table is Sheet1);
//Map Sex from numbers to Man or Woman
SexMap:
Mapping Load * inline [
SexID, Sex
1, Female
2, Male
];
People:
LOAD
ID,
ApplyMap ('SexMap',Sex) as Gender
Resident TempData1;
TempData2:
CrossTable([Information Source], Data, 1)
LOAD ID,
Internet,
Leaflet,
Friend
Resident TempData1;
Drop table TempData1;
InfoSource:
Load
ID,
[Information Source]
Resident TempData2
Where Data = 1;
Drop table TempData2;
- Mark as New
- Bookmark
- Subscribe
- Mute
- Subscribe to RSS Feed
- Permalink
- Report Inappropriate Content
Josh,
It works, indeed! Thank you very much!
Look for me while be in Poland.
You have a beer!