Unlock a world of possibilities! Login now and discover the exclusive benefits awaiting you.
- Qlik Community
- :
- All Forums
- :
- QlikView App Dev
- :
- Re: Analytic Functions
- Subscribe to RSS Feed
- Mark Topic as New
- Mark Topic as Read
- Float this Topic for Current User
- Bookmark
- Subscribe
- Mute
- Printer Friendly Page
- Mark as New
- Bookmark
- Subscribe
- Mute
- Subscribe to RSS Feed
- Permalink
- Report Inappropriate Content
Analytic Functions
Hi All,
Could anyone tell me if we can use aggr function in QlikView scripting?
Regards,
Gokul
- Tags:
- qlikview_scripting
- « Previous Replies
-
- 1
- 2
- Next Replies »
- Mark as New
- Bookmark
- Subscribe
- Mute
- Subscribe to RSS Feed
- Permalink
- Report Inappropriate Content
Hi,
In script you can use Group By instead of Aggr in load script for aggregating the data and you can use all Aggregation Functions
( Sum,Count,Avg,Only,Mode,firstsortedvalue, Concat ) etc
Ex:-
Load Week, ArtNo,
round(Avg(TransAmount),0.05) as WeekArtNoAverages
from table.csv group by Week, ArtNo;
Regards
Anand
- Mark as New
- Bookmark
- Subscribe
- Mute
- Subscribe to RSS Feed
- Permalink
- Report Inappropriate Content
Hello,
No you cannot.
You can use group by though. What's the scenario?
BR
Serhan
- Mark as New
- Bookmark
- Subscribe
- Mute
- Subscribe to RSS Feed
- Permalink
- Report Inappropriate Content
Hi Serhan,
Thanks for the response.
Well the scenario goes like this: We have a Product Group column, Product Column and sales column.
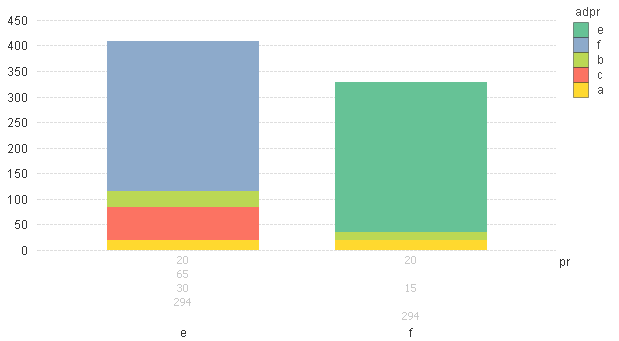
We would like to sort this first based on sum of sales for product group and then for each product within that group. A product can appear in more than one group. And finally we want to do this in a Bar chart. So the ordering of the bars is by sales for product group and the ordering of groups within bars is by products sales.
So the idea was if we could get sum of Product group maybe we could use it to help in sorting bar graph.
| Product Group | Product | Sales |
| e | f | 96 |
| e | f | 34 |
| e | f | 96 |
| e | f | 34 |
| e | f | 34 |
| e | c | 65 |
| e | b | 30 |
| e | a | 20 |
| f | e | 96 |
| f | e | 34 |
| f | e | 96 |
| f | e | 34 |
| f | e | 34 |
| f | a | 20 |
| f | b | 9 |
Regards,
Gokul
- Mark as New
- Bookmark
- Subscribe
- Mute
- Subscribe to RSS Feed
- Permalink
- Report Inappropriate Content
if that's all you want to do...just load the table into qlik, create a bar chart with dimensions as product group and product and expression as sum(Sales). you can sort depending on the requirement in the Sort tab of object properties.
but if this has to be done on the script side which is always a good idea, use group by like the above posters suggested...
load
[Product Group],
[Product],
sum(Sales) as SalesTotal
from tablename
group by [Product], [Product Group];
- Mark as New
- Bookmark
- Subscribe
- Mute
- Subscribe to RSS Feed
- Permalink
- Report Inappropriate Content
Hi Saradhi,
Sorting on the secondary dimension is some times difficult.
What we were able to achieve is the following:
1. We are able to align the bar graph by Product Group -- Done.
2. The categories within each bar are not getting sorted -- Pending.
Not the values on the axis:
Unsorted : 20 65 30 294
Thanks,
Gokul
- Mark as New
- Bookmark
- Subscribe
- Mute
- Subscribe to RSS Feed
- Permalink
- Report Inappropriate Content
Hi,
Check this links, Aggr() works similarly to Group by. Suppose if you want to sum up the sales of customers who has sold more that 1 million then Aggr() will help
=Sum(Aggr(If(Sum(Sales)> 1000000, Sum(Sales), 0), Customer)) --This is just a sample, this can be achieved in many other ways
Aggr() - Will loop through each Customer
If() - Checks whether Sales > 1000000 for each customer
QlikView Technical Brief - AGGR
Hope this helps you.
Regards,
Jagan.
- Mark as New
- Bookmark
- Subscribe
- Mute
- Subscribe to RSS Feed
- Permalink
- Report Inappropriate Content
Thanks Jagan. Do you by any chance have some references on how bar graph sorting options work internally?
Thanks,
Gokul
- Mark as New
- Bookmark
- Subscribe
- Mute
- Subscribe to RSS Feed
- Permalink
- Report Inappropriate Content
Hi,
Can you attach sample file?
Regards,
Jagan.
- Mark as New
- Bookmark
- Subscribe
- Mute
- Subscribe to RSS Feed
- Permalink
- Report Inappropriate Content
Hi Jagan,
The following thread is the same problem we are trying to solve.
Stacked Bar Chart Sorting- 2 Dimension 1 Expression
Thanks.
- « Previous Replies
-
- 1
- 2
- Next Replies »