Unlock a world of possibilities! Login now and discover the exclusive benefits awaiting you.
- Qlik Community
- :
- All Forums
- :
- QlikView App Dev
- :
- Re: Rolling 4 week average in mini chart
- Subscribe to RSS Feed
- Mark Topic as New
- Mark Topic as Read
- Float this Topic for Current User
- Bookmark
- Subscribe
- Mute
- Printer Friendly Page
- Mark as New
- Bookmark
- Subscribe
- Mute
- Subscribe to RSS Feed
- Permalink
- Report Inappropriate Content
Rolling 4 week average in mini chart
Hi All , gwassenaar
I am having a requirement to display mini chart in Straight table along with other columns in the same table.
We have data based on week ending date and based on this we have to show 4 week data average in mini chart.
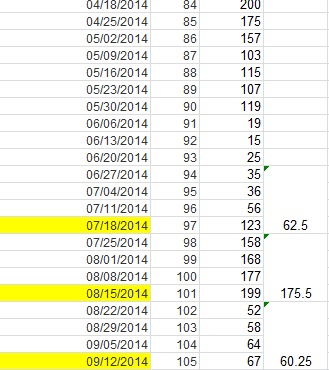
For eg : What ever is the maximum week ending date based on that the group should happen for average of 4 weeks In the screen shot below you can see the highlighted date to get the average of above 4 weeks and that particular date should get displayed in mini chart.
If I have 52 weeks for the current year and based on this the average will be from last 4 weeks and so on and only 13 dates should get displayed.
Our requirement is similar the way it is present in the screen shot below :
Please let me know if you have any questions on this. I have added the spreadsheet with dummy data,
Does anyone had implemented the mini chart in the same way or can anyone help me on this?
Thanks in advance
Punit
Accepted Solutions
- Mark as New
- Bookmark
- Subscribe
- Mute
- Subscribe to RSS Feed
- Permalink
- Report Inappropriate Content
Hi All,
Created a indicator on the script level and achieved what I am asking for.
Script change Floor((Row No()-1)/4) as Rolling_4_Week_Id
Thanks
Punit
- Mark as New
- Bookmark
- Subscribe
- Mute
- Subscribe to RSS Feed
- Permalink
- Report Inappropriate Content
Hi Punit,
Please check below post:
Calculating rolling n-period totals, averages or other aggregations
Regards
Neetha
- Mark as New
- Bookmark
- Subscribe
- Mute
- Subscribe to RSS Feed
- Permalink
- Report Inappropriate Content
Hi Neetha_p
Thanks for the link but, I need to implement above scenario in mini chart and in mini chart we cant use the calculated dimension, right?
Could you please help me to achieve this
- Mark as New
- Bookmark
- Subscribe
- Mute
- Subscribe to RSS Feed
- Permalink
- Report Inappropriate Content
Hi All,
Created a indicator on the script level and achieved what I am asking for.
Script change Floor((Row No()-1)/4) as Rolling_4_Week_Id
Thanks
Punit