Unlock a world of possibilities! Login now and discover the exclusive benefits awaiting you.
- Qlik Community
- :
- Forums
- :
- Analytics
- :
- App Development
- :
- Re: One dimension and two measures on a bar chart
- Subscribe to RSS Feed
- Mark Topic as New
- Mark Topic as Read
- Float this Topic for Current User
- Bookmark
- Subscribe
- Mute
- Printer Friendly Page
- Mark as New
- Bookmark
- Subscribe
- Mute
- Subscribe to RSS Feed
- Permalink
- Report Inappropriate Content
One dimension and two measures on a bar chart
Hi!
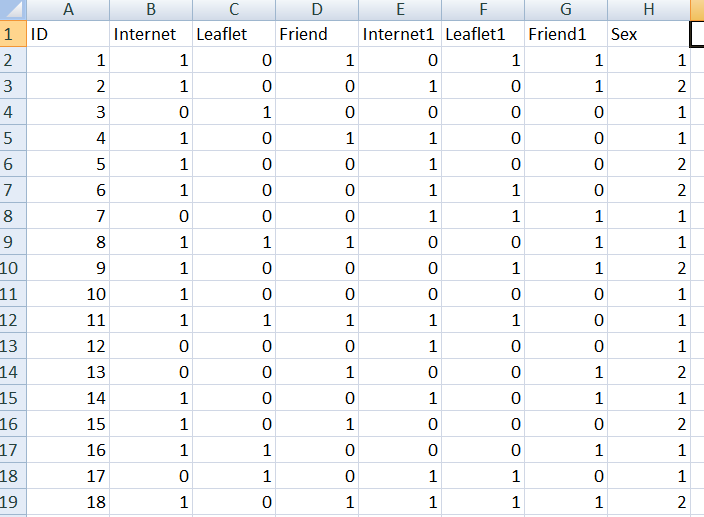
I would like to create a bar chart displaying two variants of one dimension. I have data coded like this (file attached)
And I'm trying to create QS charts, similar to this:
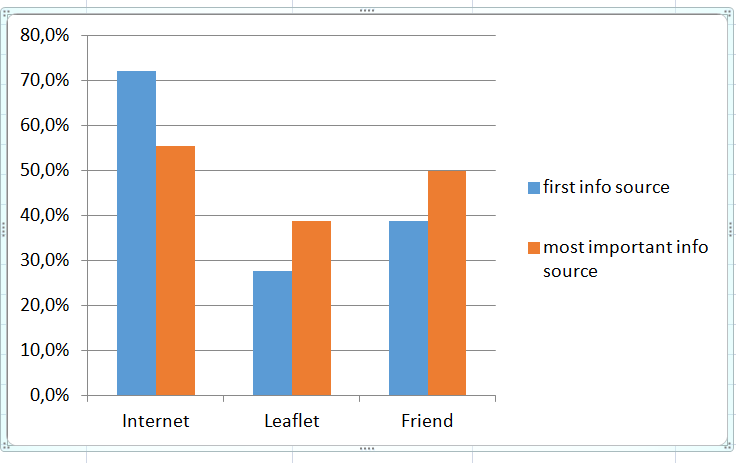
Does anyone have an idea, what scripting should I use?
I will be very thankful for every solution 
Thank You
All the best
Przemyslav
- Mark as New
- Bookmark
- Subscribe
- Mute
- Subscribe to RSS Feed
- Permalink
- Report Inappropriate Content
I think that it can be done with the "CrossTable LOAD" in loadscript.
See the attached QVF.
- Mark as New
- Bookmark
- Subscribe
- Mute
- Subscribe to RSS Feed
- Permalink
- Report Inappropriate Content
Yes.
Try creating the script in QlikView first. It has an interface to create cross tables. And then you can copy it to Qlik Sense.
BR
Serhan
- Mark as New
- Bookmark
- Subscribe
- Mute
- Subscribe to RSS Feed
- Permalink
- Report Inappropriate Content
Tsutomu,
Thank you very much for your answer. Actually, it works well but synthetic keys appear and I wonder if it's ok. I'm gona try to find out a solution to avoid it.
Serhan,
I'm gonna get into QlikView - its a good idea, thanks for advise.
I'll be back here in 2 days and tell you what I find out.
Thanks for discussion
- Mark as New
- Bookmark
- Subscribe
- Mute
- Subscribe to RSS Feed
- Permalink
- Report Inappropriate Content
Hi,
There is another way to do it w/out scripting . It's little bit tricky .
Br,