Unlock a world of possibilities! Login now and discover the exclusive benefits awaiting you.
- Qlik Community
- :
- Forums
- :
- Analytics
- :
- New to Qlik Analytics
- :
- Re: Count If Condition, Standard Deviation ,Averag...
- Subscribe to RSS Feed
- Mark Topic as New
- Mark Topic as Read
- Float this Topic for Current User
- Bookmark
- Subscribe
- Mute
- Printer Friendly Page
- Mark as New
- Bookmark
- Subscribe
- Mute
- Subscribe to RSS Feed
- Permalink
- Report Inappropriate Content
Count If Condition, Standard Deviation ,Average
Hi All,
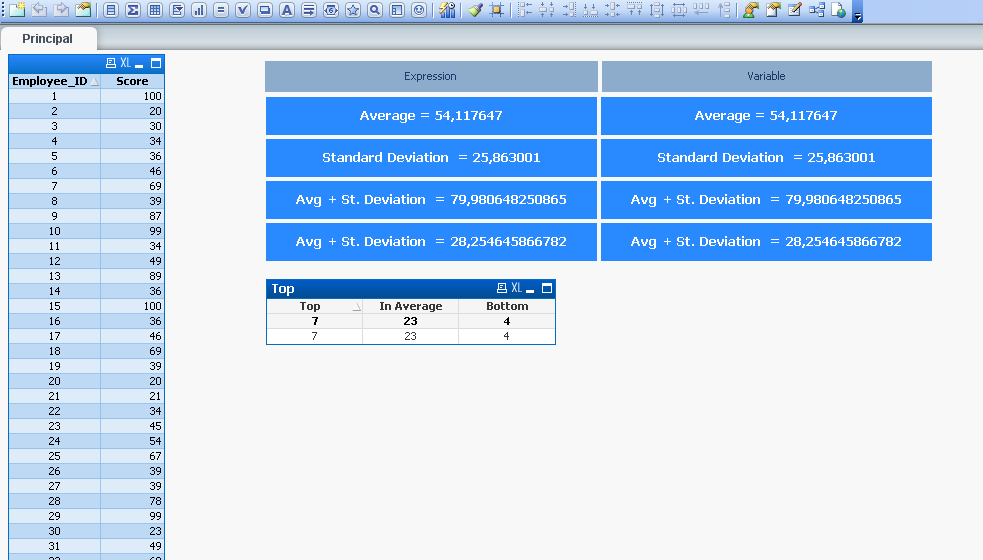
I am facing a challenge to write expression involving count if, standard deviation and average. I have the list of employees along with their test scores. I need to club the employees based on their score after normalization.
Employees Receiving more then [Average Score+ Standard Deviation of Score] will be Top Performers
Employees Receiving less then [Average Score-Standard Deviation of Score] will be Bottom Performers
Employees Receiving in the range of [Average Score-Standard Deviation of Score,Average Score+ Standard Deviation of Score ] will be Average Performers.
I have attached the list of sample calculation done on excel.
Thanks in Advance.
Regards
Anurag Gupta
- Mark as New
- Bookmark
- Subscribe
- Mute
- Subscribe to RSS Feed
- Permalink
- Report Inappropriate Content
Is this?

- Mark as New
- Bookmark
- Subscribe
- Mute
- Subscribe to RSS Feed
- Permalink
- Report Inappropriate Content
attached the file qv
- Mark as New
- Bookmark
- Subscribe
- Mute
- Subscribe to RSS Feed
- Permalink
- Report Inappropriate Content
hi have a look at the attach example
- Mark as New
- Bookmark
- Subscribe
- Mute
- Subscribe to RSS Feed
- Permalink
- Report Inappropriate Content
Hi Anurag,
Please see attached. I calculate the average and standard deviation on import, then classify each employee based on how their score compares to the classification system (top performer, bottom performer, etc.)
Hope that helps.
Matt
- Mark as New
- Bookmark
- Subscribe
- Mute
- Subscribe to RSS Feed
- Permalink
- Report Inappropriate Content
Hi Enrique,
Thanks for your help. I am new to Qlik. Currently i am using Qliksense so not averse with Qlikview Scripting techniques.
Can you help me with QVF file ,if possible ?
Regards
Anurag Gupta
- Mark as New
- Bookmark
- Subscribe
- Mute
- Subscribe to RSS Feed
- Permalink
- Report Inappropriate Content
Hi Mathew,
Thanks for your help. I am new to Qlik. Currently i am using Qliksense so not averse with Qlikview Scripting techniques.
Can you help me with QVF file ,if possible ?
Regards
Anurag Gupta
- Mark as New
- Bookmark
- Subscribe
- Mute
- Subscribe to RSS Feed
- Permalink
- Report Inappropriate Content
Hi Liron,
Thanks for your help. I am new to Qlik. Currently i am using Qliksense so not averse with Qlikview Scripting techniques.
Can you help me with QVF file ,if possible ?
Regards
Anurag Gupta
- Mark as New
- Bookmark
- Subscribe
- Mute
- Subscribe to RSS Feed
- Permalink
- Report Inappropriate Content
sure thing
here is a qlik sense example
- Mark as New
- Bookmark
- Subscribe
- Mute
- Subscribe to RSS Feed
- Permalink
- Report Inappropriate Content
Hi Anurag,
I'm not using qlik sense yet, but can try to walk you through it.
First, create an app, then open the script editor and add the following (my understanding is this will import fine in qlik sense):
Data:
LOAD * INLINE [
Employee ID , Score
1, 100
2, 20
3, 30
4, 34
5, 36
6, 46
7, 69
8, 39
9, 87
10, 99
11, 34
12, 49
13, 89
14, 36
15, 100
16, 36
17, 46
18, 69
19, 39
20, 20
21, 21
22, 34
23, 45
24, 54
25, 67
26, 39
27, 39
28, 78
29, 99
30, 23
31, 49
32, 69
33, 96
34, 49
];
// Calculating average and standard deviation
Join
LOAD
Avg(Score) as AverageScore,
Stdev(Score) as StdevScore
Resident Data;
// Classifying data based on performance
tmpData:
NoConcatenate
LOAD *,
if(Score > AverageScore + StdevScore, 'Top Performer',
if(Score < AverageScore - StdevScore, 'Bottom Performer',
'Average Performer')) as Class
Resident Data;
Drop Table Data;
RENAME Table tmpData to Data;
Then create a table and add Class as a dimension along with this calculated dimension which I called Range:
=if(Class = 'Top Performer', '>79', if(Class = 'Bottom Performer', '<28', if(Class = 'Average Performer', '>28 and < 79')))
Finally add the following expression to get the count per Class:
=count([Employee ID])
This will produce the table you had in your excel:

Hope that helps. I may get a chance to get up and running in qlik sense this week, in which case I'll send you the qvf as well.
Matt