Unlock a world of possibilities! Login now and discover the exclusive benefits awaiting you.
- Qlik Community
- :
- All Forums
- :
- QlikView App Dev
- :
- Re: Showing Percentage Totals by Year
- Subscribe to RSS Feed
- Mark Topic as New
- Mark Topic as Read
- Float this Topic for Current User
- Bookmark
- Subscribe
- Mute
- Printer Friendly Page
- Mark as New
- Bookmark
- Subscribe
- Mute
- Subscribe to RSS Feed
- Permalink
- Report Inappropriate Content
Showing Percentage Totals by Year
Hello,
Thank you for taking this question in advance.
Basically, I have data that spans across 4 years (2011, 2012, 2013, 2014). I want to show it by two Dimensions, 'Engaged' which is either a Yes or No, and over each year.
I want the percentages to show 'Y' or 'N' for 100% across EACH year, rather than 100% across all 4 years (which is how it currently shows).
Example: For 2011, I want 'Y' to show for 70% and 'N' to show for 30%, 2012 to show 'Y' for 80% and 'N' to show for 20%, rather than showing all the 'Y' and 'N' 2011 + 2012 + 2013+ 2014 adding up to 100%.
I have attached screen shots below of what the graph currently shows, along with the dimensions and expression.
I really appreciate the help!
Thanks!
- Mark as New
- Bookmark
- Subscribe
- Mute
- Subscribe to RSS Feed
- Permalink
- Report Inappropriate Content
hi Ryan,
if you want to include the above condition you do not need to include an if condition, instead you can can expand your set analysis expression like:
=
Count({<Engaged={'y'},[IPO Type]={'IPOs Filed & Priced'},[Expected / Actual Amount raised]>={'150000000'}>}DISTINCT id)/Count(distinct id)
Regards
Saurabh
- Mark as New
- Bookmark
- Subscribe
- Mute
- Subscribe to RSS Feed
- Permalink
- Report Inappropriate Content
and for engaged as no..
=
Count({<Engaged={'n'},[IPO Type]={'IPOs Filed & Priced'},[Expected / Actual Amount raised]>={'150000000'}>}DISTINCT id)/Count(distinct id)
- Mark as New
- Bookmark
- Subscribe
- Mute
- Subscribe to RSS Feed
- Permalink
- Report Inappropriate Content
Hi Saurabh,
Thanks so much for your quick response. For some reason when I put that expression into Qlikview, I got the error:
'Error in set modifier expression'
I am not quite sure what this means. Would you be able to point me in the correct direction? The conditions that I have in the expression are correct, I am unsure of where I am going wrong.
Thanks again for all your help!
- Mark as New
- Bookmark
- Subscribe
- Mute
- Subscribe to RSS Feed
- Permalink
- Report Inappropriate Content
See if this one works:
For Yes:
=Count({<Engaged={'y'},[IPO Type]={'IPOs Filed & Priced'},[Expected / Actual Amount raised] = {'>=150000000'}>}DISTINCT id)/Count(distinct id)
For No:
=Count({<Engaged={'n'},[IPO Type]={'IPOs Filed & Priced'},[Expected / Actual Amount raised] = {'>=150000000'}>}DISTINCT id)/Count(distinct id)
Best,
S
- Mark as New
- Bookmark
- Subscribe
- Mute
- Subscribe to RSS Feed
- Permalink
- Report Inappropriate Content
Excellent! This worked! Thank you!
I almost have exactly what I am looking for with one exception:
**Please refer to attachment for reference**
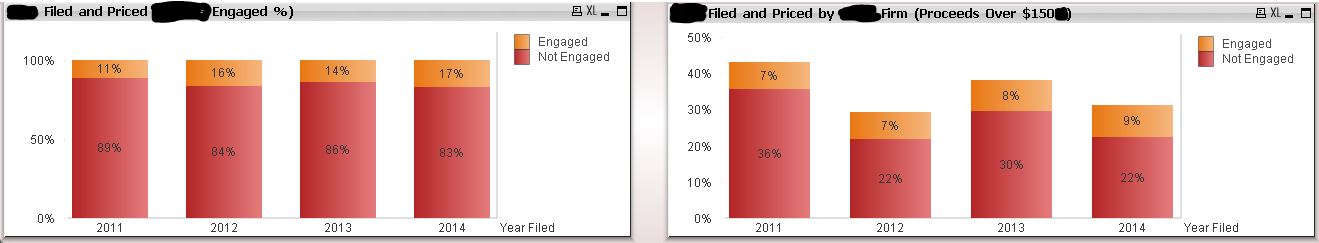
The percentages are now showing for only the population that meets the criteria (i.e. in 2014, only 31% of the total population exceeded $150M) so it is being split into only 9% and 22% respectively.
I was hoping to split the population up relative to each other (i.e. the entire population would be made up of only those that are greater than $150M) so that it would show 100% total.
For example, looking at 2014: rather than showing only 9% Engaged and 22% Not Engaged (which takes into account the entire population), I would want it to show only the breakdown for the over $150M population.
In effect, it would show Engaged: 29% (9/31)
Not Engaged: 71% (22/31)
I tried selecting the 'Relative' option in expressions and this did not work. Any idea on how I can get this to work?
Thanks again for all the help!
- Mark as New
- Bookmark
- Subscribe
- Mute
- Subscribe to RSS Feed
- Permalink
- Report Inappropriate Content
Try this:
=Count({<Engaged={'y'},[IPO Type]={'IPOs Filed & Priced'},[Expected / Actual Amount raised] = {'>=150000000'}>}DISTINCT id)/Count({<[Expected / Actual Amount raised] = {'>=150000000'}>} DISTINCT id)
For No:
=Count({<Engaged={'n'},[IPO Type]={'IPOs Filed & Priced'},[Expected / Actual Amount raised] = {'>=150000000'}>}DISTINCT id)/Count({<[Expected / Actual Amount raised] = {'>=150000000'}>} DISTINCT id)
Instead of dividing with all the count, we are not dividing by the observations which are over 150000000.
Hope this helps
Best,
S
- Mark as New
- Bookmark
- Subscribe
- Mute
- Subscribe to RSS Feed
- Permalink
- Report Inappropriate Content
And in case you have to account for the IPO Type in the denominator also then the formulas would be:
=Count({<Engaged={'y'},[IPO Type]={'IPOs Filed & Priced'},[Expected / Actual Amount raised] = {'>=150000000'}>}DISTINCT id)/Count({<[IPO Type]={'IPOs Filed & Priced'},[Expected / Actual Amount raised] = {'>=150000000'}>} DISTINCT id)
For No:
=Count({<Engaged={'n'},[IPO Type]={'IPOs Filed & Priced'},[Expected / Actual Amount raised] = {'>=150000000'}>}DISTINCT id)/Count({<[IPO Type]={'IPOs Filed & Priced'},[Expected / Actual Amount raised] = {'>=150000000'}>} DISTINCT id)
Best,
S
- Mark as New
- Bookmark
- Subscribe
- Mute
- Subscribe to RSS Feed
- Permalink
- Report Inappropriate Content
Hi S,
That worked perfectly! Thank you!
I have one more question and then my Dashboard should be ready to go.
I am trying to show percentages of Accounts that have been Filed and Priced by Firm: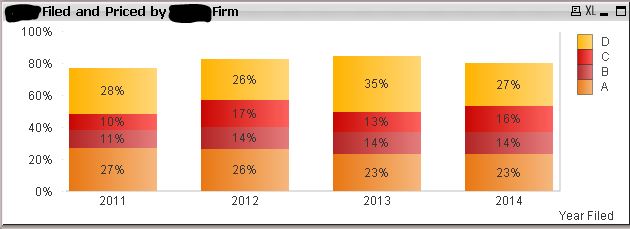
I have written four seperate expressions, one for each firm. See below:
For A
Count({<[Audit Firm]={'A'}>}DISTINCT ID)/Count(distinct ID)
For B
Count({<[Audit Firm]={'B'}>}DISTINCT ID)/Count(distinct ID)
Etc.
These are the 4 main Firms; however, there are many more small firms that make up the remainder of the 100% (Notice that the 4 stacked graphs currently do not add up to 100%).
I wanted to create a 5th expression called 'Other' that encompasses everything else that is not Firms A,B,C,D.
I would really appreciate if someone could help me formulate the proper expression.
Thanks in advance!
- Mark as New
- Bookmark
- Subscribe
- Mute
- Subscribe to RSS Feed
- Permalink
- Report Inappropriate Content
I am not sure if this is going the work the way you want, but if I had the data, I would write the following 5th expression:
=Count({<[Audit Firm]=e({<[Audit Firm] = {'A', 'B', 'C', 'D'}>})>}DISTINCT ID)/Count(distinct ID)
Here the e is telling you to exclude A, B, C, D from the numerator count.
Let me know if it works.
Best,
S
- Mark as New
- Bookmark
- Subscribe
- Mute
- Subscribe to RSS Feed
- Permalink
- Report Inappropriate Content
When I tried using this expression I got the following error:
What does this signify?
Thank you